ZealousWeb
eCommerce analytics tools

How Analyzing Your Store’s Data Helps You Sell More Online

September 15, 2025Posted By: Manjiri Bhate
Data-Driven DecisionseCommerce analyticsLooker StudioPower BI

Every successful eCommerce journey starts with a spark—an idea, a product, a vision for growth. But what truly separates fleeting success from lasting impact is how well you understand and act on your data. The Global eCommerce market is expected to reach $7.95 trillion by 2027, with online shopping making up over 20% of retail revenue. The competition is fierce and fast-moving. Simply managing daily operations isn’t enough anymore.

There’s a crucial difference between running a store and scaling it, and understanding this can change the game:

  • Running a Store means managing daily orders, maintaining operations, and ensuring customers can shop without hiccups.
  • Scaling a Store means expanding reach, increasing revenue, optimizing processes, and using data-driven insights to make smarter decisions and outpace competitors.

Many store owners overlook valuable insights hiding in their data, instead relying on gut feelings or surface-level reports. This oversight means missing opportunities such as identifying best-selling products, anticipating inventory needs, and understanding customer behavior—all critical to driving sustainable growth.

This blog is designed to reveal those hidden insights and show how practical, actionable eCommerce analytics can transform guesswork into confident strategy. Let’s dive in to discover how tapping into your store’s data can unlock its true potential.

What Do We Mean by “Analyzing Store Data”?

When we talk about “analyzing store data,” it’s essential to start with a clear understanding of what data we’re dealing with. Every eCommerce store collects a wealth of information through daily operations, but it’s easy to overlook just how many different types of data flow through your business.

Store data encompasses several key categories that together tell the whole story of your store’s health and potential. These include:

  • Sales data covers everything from how many orders you received, the revenue generated, order values, and sales trends over time.
  • Traffic data reveals where your visitors are coming from—whether search engines, social media, paid ads, or direct visits—along with details about their browsing patterns.
  • Customer behavior data digs deeper into how shoppers interact with your store: what products they view, add to carts, and ultimately purchase, as well as how frequently they return.
  • Product performance data highlights which Stock Keeping Unit (SKUs) are flying off the shelves and which are lagging, helping you understand demand, seasonality, and product lifecycle.

Moving forward, platforms like Shopify, WooCommerce, and Magento play a crucial role in collecting, organizing, and presenting this data. Each of these popular eCommerce platforms comes with built-in tools and integrations designed to capture extensive data points seamlessly as transactions and user interactions happen in real time. The sophistication of these platforms’ data collection capabilities ensures that store owners have access to the underlying raw data necessary for meaningful analysis.

When it comes to analysis, store owners face a choice between doing it themselves using DIY tools or leveraging full-stack analytics solutions. Here’s a clear comparison to highlight the differences:

Aspect DIY Tools Full-Stack Analytics
Ease of Use User-friendly, generally plug-and-play More complex, it requires expertise
Data Integration Limited to platform-specific data or basic integrations Combines multiple data sources deeply
Customization Basic custom reports and dashboards Highly customizable, tailored insights
Depth of Insights Surface-level trends and metrics Deep analytics with predictive and prescriptive insights
Cost Often lower or included in platform fees Typically higher, but scalable
Actionability Suitable for small to mid-size stores Ideal for growth-focused stores needing precision decisions


Understanding these differences helps you decide the right level of analysis for your store’s current stage and goals. Now let’s explore exactly how these insights can drive real sales growth for your eCommerce business.

6 Key Ways Data Analysis Drives More Sales

If there’s one thing every store owner wants, it’s more sales, but to achieve it, it’s not about hustling harder or chasing trends. It’s about truly understanding what’s happening in your business, so you can make choices that move the needle in the right way. That’s where data analysis takes the guesswork out of growth and shows you clear paths to sell more, serve customers better, and build something that lasts.

In this section, let’s take a straightforward look at six key ways data can help you boost your sales.

Understand What Products Sell (and When)

Surprisingly, most store owners have a completely wrong idea about which products are driving their business forward. They rely on customer feedback, what feels busy, or what they love about their inventory. But feelings and reality don’t always match up, and that gap can cost you serious revenue.

Your sales data can show you which products customers put their money behind, not just what they browse or ask about. You can identify which individual products consistently perform, which bundles customers find irresistible, and which items have precise seasonal rhythms that repeat year after year.

Improve Ad Targeting and ROI

Every store owner spends money on ads across different platforms, hoping something sticks, but never really knowing which campaigns are worth the investment and which ones are just draining your budget. That’s where traffic and campaign analysis become your financial lifeline. You can look at clicks and impressions, as well as track which channels bring customers who actually buy, spend more, and come back for repeat purchases.

Armed with this knowledge, you can make strategic budget allocation decisions that make sense. When you know which channels work best for your specific business and audience, you’re not just improving ROI; you’re building a sustainable, profitable growth engine.

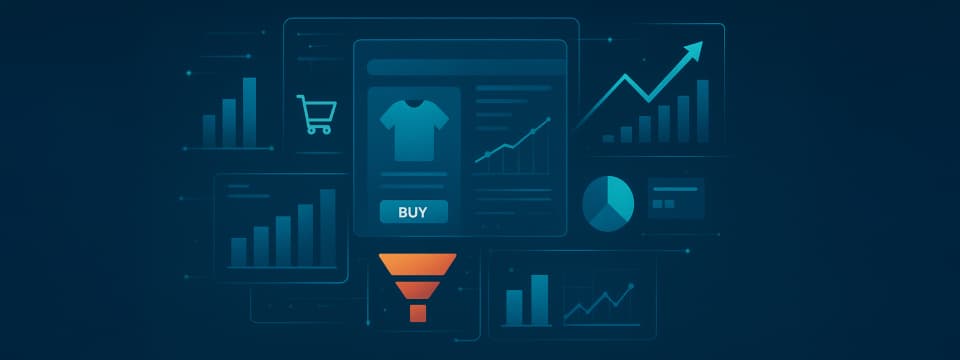
Optimize Checkout & Funnel Drop-Offs

Nothing breaks a store owner’s heart quite like watching potential customers get to checkout, fill their cart with products they want, and then… disappear. The truth is, this isn’t bad luck or indecisive shoppers—it’s usually friction in your customer journey that you can identify and fix.

Funnel analytics can help the owners as a detective tool. Funnel analytics tracks exactly how customers move through each step of this journey, showing you where people are dropping off and why they might be leaving.

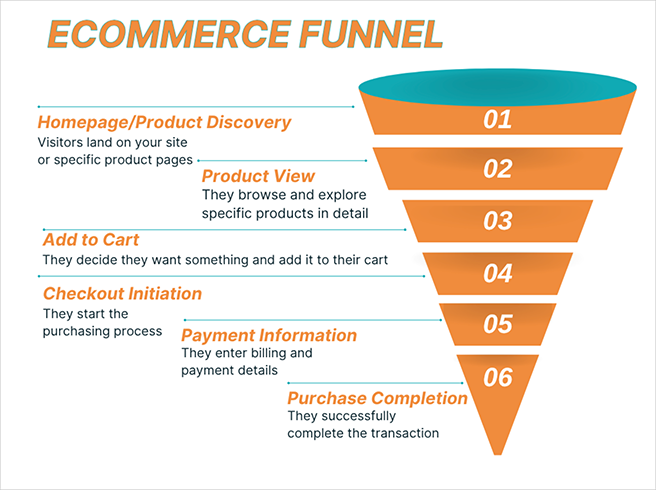
Here’s what a typical eCommerce funnel looks like and what to watch for:

Ecommerce funnel

Consider this:

Maybe 1,000 people visit your product pages, but only 200 add items to their cart—that’s a 20% add-to-cart rate. Of those 200, maybe only 100 start checkout (50% checkout initiation rate), and only 60 complete their purchase (60% completion rate).

When you spot dramatic drop-offs at specific stages, you’ve found your friction points. In funnel analysis, minor improvements often create significant results. Simplifying a checkout form might boost completion rates, or adding trust badges or offering guest checkout could eliminate concerns that make people hesitate at the final step.

Segment High-Value Customers and Retain Them

Most businesses are unaware of who these VIP customers are, which means they’re missing out on nurturing the relationships that could drive the most growth. This is where customer segmentation and lifetime value (LTV) analysis help. Instead of seeing your customer base as one big group, you start identifying distinct segments based on their actual behavior and value to your business.

LTV analysis takes this a step further by calculating how much revenue each customer segment is likely to generate over their entire relationship with your store. Meanwhile, cohort behavior analysis groups customers by when they first purchased and tracks how their spending patterns evolve. Once you understand these patterns, you can create personalized experiences that speak directly to each segment’s preferences and behaviors. This results in higher retention rates, increased customer lifetime value, and a business model built around nurturing your most valuable relationships.

Predict Inventory Needs Before You Sell Out

Understocking and overstocking of inventory are crushing for any business, but the best part is that they are preventable with the right approach to inventory forecasting. Most store owners order inventory based on gut feelings. By analyzing your historical sales data alongside seasonal patterns, you can forecast demand before it hits, giving you the power to stay ahead of customer needs.

For example, your data might show that winter coats start selling in early October, peak in December, and drop off dramatically by February. But it also reveals that this year you’re selling 30% more than last year due to business growth. These insights help you to avoid both stockouts and excess inventory.

This predictive approach transforms inventory management from constant stress into a competitive advantage. While competitors scramble to restock popular items or desperately move excess inventory, you’re operating with confidence, knowing you have exactly what customers want, exactly when they want it.

Identify Underperforming Channels or Products

Here’s an uncomfortable truth every store owner needs to face: some of your products and marketing channels are secretly sabotaging your success. They might look busy on the surface, generating some sales or traffic, but when you dig into the real numbers, they’re costing more than they’re worth. That’s where data analysis helps you uncover Dead-weight SKUs and low-ROI marketing channels.

For instance, your handmade jewelry garners social media attention, but it generates a small portion of your revenue. Yet, it accounts for a considerable portion of your marketing budget. Once you identify these underperformers, you can either fix them or let them go. That slow-moving product needs better positioning, or it’s time to discontinue it and redirect resources to proven winners. That low-converting channel might need a different approach, or you’d be better off reallocating the budget elsewhere.

These six strategies are the foundation of every successful eCommerce operation.

Fun fact!

Data-driven eCommerce businesses are 23 times more likely to acquire customers and 19 times more likely to be profitable than those relying on guesswork.

But these strategies work even better when you can see them in action. So let’s look at some real-world scenarios where store owners just like you used these exact approaches to solve everyday challenges and drive serious growth.

Real-World Use Cases from eCommerce Brands

Best-performing stores aren’t relying on guesswork or single reports anymore. Instead, they’re using integrated systems where their sales data talks to their email marketing, their website analytics connects with inventory decisions, and their customer behavior insights feed directly into their advertising strategies.

This connected approach changes everything. Instead of wondering why sales dipped last month or guessing which products to promote, brands get a clear, complete picture of what’s happening in their business.

The real breakthrough happens when patterns across all these different touchpoints make complete sense. Here’s how four different store owners used this integrated approach to solve challenges that might sound very familiar:

smart brand data usage

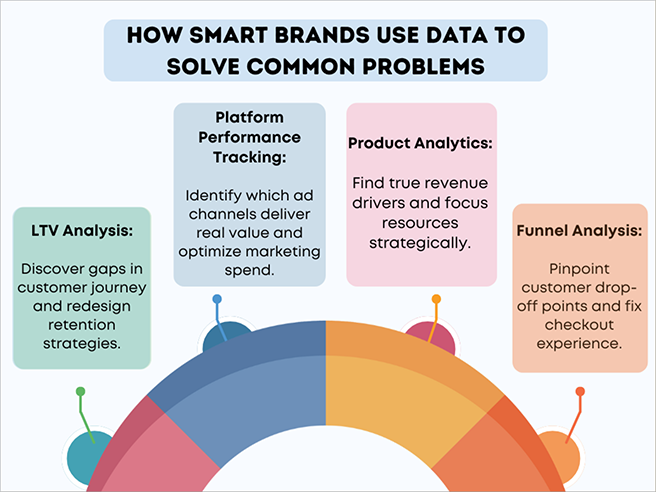
These use cases demonstrate the power of a well-chosen data approach when you know what to look for and how to act on it.

Here’s what’s exciting: 97% of retailers plan to increase their AI investments in 2025, while companies using data-driven approaches report a 46.15% improvement in decision outcomes. The momentum is undeniable as 95% of businesses acknowledge they need better data management, and those who get it right see operational efficiency increases of up to 80%.

But knowing these strategies is just the beginning. The real question is to implement them in your store. Let’s explore the practical tools and platforms that can make this possible for your business.

Store’s data

Metrics to Watch If You Want to Sell More

Running a successful eCommerce store is about tracking the correct numbers that tell you what’s working and what’s not. Metrics are your business’s vital signs. They reveal the health of your operations, show you where opportunities hide, and help you make decisions that drive real growth.

But not all metrics are created equal. While you could spend hours analyzing dozens of different numbers, six core metrics have the most significant impact on your bottom line. These vanity numbers are actionable insights that directly influence how much you sell and how profitably you grow.

Conversion Rate (CVR)

Your conversion rate is arguably the most critical metric in eCommerce. It tells you exactly how well your store turns visitors into paying customers. Simply put, it’s the percentage of people who visit your site and make a purchase. This metric reveals how effectively your website, product pages, and overall user experience convert interest into sales.

Conversion rate

For example, if 1,000 people visit your store and 25 make a purchase, your conversion rate is 2.5%.

The average eCommerce conversion rate sits between 2.5% and 3%, but top-performing stores often achieve rates above 4%. Improving conversion rate is often more cost-effective than spending money to drive more visitors, as it maximizes the value of customers you’re already attracting.

Customer Lifetime Value (LTV)

Customer Lifetime Value measures the total revenue you can expect from a single customer throughout their entire relationship with your business. It’s about understanding the long-term value of each customer, not just their first purchase. This metric helps you understand how much you can afford to spend on acquiring new customers while remaining profitable.

CLTV

For example, if your average customer spends $50 per purchase, buys 4 times per year, and stays with you for 2 years, their LTV is $400.

When you know your LTV, you can justify higher customer acquisition costs for valuable segments and invest more in retention strategies. Companies that focus on increasing LTV often see more sustainable, profitable growth than those chasing new customers alone.

Average Order Value (AOV)

Average Order Value tracks how much money customers spend, on average, each time they purchase from your store. This metric directly impacts your profitability because there are fixed costs associated with each order, like payment processing, packaging, and shipping.

AOV

For example, if you generate $10,000 in revenue from 200 orders, your AOV is $50.

Higher order values mean better margins and more efficient use of your marketing spend. Increasing AOV through strategies like product bundling, upselling, and cross-selling is often easier than acquiring new customers, leading to more revenue from your existing traffic.

Cart Abandonment Rate

This metric shows the percentage of shoppers who add items to their cart but leave without completing their purchase. The average cart abandonment rate represents a massive opportunity for most stores. These are warm prospects who’ve already shown purchase intent—they just need the right nudge to complete their order.

Cart Abandonment Rate

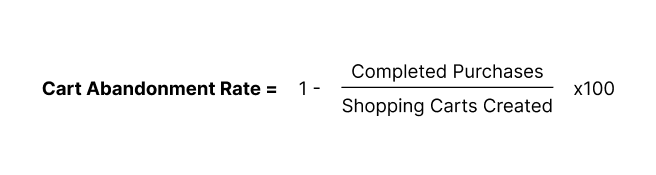
For example, if 100 people create shopping carts but only 30 complete their purchases, your cart abandonment rate is 70%.

By identifying and addressing the reasons for cart abandonment—like unexpected shipping costs, complicated checkout processes, or limited payment options—you can recover significant revenue from traffic you’re already paying for.

Return Customer Rate

This measures the percentage of your customers who return to make additional purchases within a specific timeframe. Repeat customers typically spend more per order and cost less to serve than new customers. A healthy return customer rate indicates intense customer satisfaction and effective retention strategies.

Return customer rate

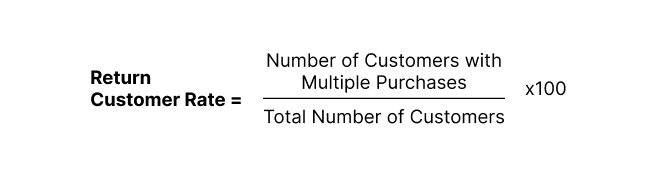
For example, if you have 1,000 total customers and 250 of them make repeat purchases, your return customer rate is 25%.

Most successful stores aim for return customer rates between 20 and 40%. Focusing on repeat customers is one of the most cost-effective ways to grow revenue, as these customers already trust your brand and are more likely to try new products.

Channel ROAS

ROAS measures how much revenue you generate for every dollar spent on advertising across different marketing channels. This metric helps you understand which advertising channels deliver the best returns, allowing you to allocate your marketing budget more effectively.

ROAS

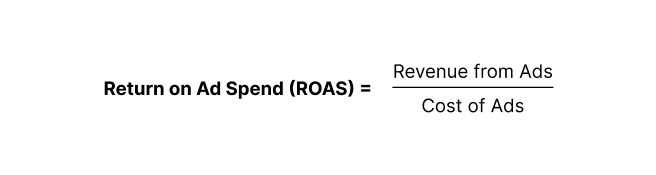
For example, if you spend $1,000 on Google Ads and generate $4,000 in revenue, your ROAS is 4:1 or 400%.

By identifying high-performing channels and reallocating budget from underperforming ones, you can maximize the impact of every marketing dollar. Most successful eCommerce businesses aim for a ROAS of at least 4:1, meaning they earn $4 for every $1 spent on ads.

When these six metrics are tracked consistently and you understand what they’re telling you, you can make informed decisions that compound over time.

Key takeaway!

eCommerce businesses don’t need to optimize everything at once. They can select one or two metrics that require the most attention, focus their efforts on these, and then move on to the next priority.

But knowing what to measure is just the first step. The real difference happens when you have the right tools and systems in place to track these metrics automatically, spot trends before they become problems, and take action quickly.

Tools That Can Help You Get Started

With numerous analytics platforms, dashboards, and software options available, it’s easy to feel overwhelmed or paralyzed by choice. But you don’t need to master every tool on the market to see real results. What you need is the right combination of tools that match your current skill level, budget, and business complexity.

Before we dive into specific tools, let’s address something crucial that most people overlook: clean data matters more than fancy tools. You can have the most sophisticated analytics platform in the world, but if your data is inaccurate, incomplete, or inconsistent, your insights will be worthless.

The foundation of good analytics is ensuring that the data feeding into those tools is accurate, complete, and reliable. This means standardizing how you collect information, regularly cleaning your databases, and maintaining consistent formats across all your systems. With that said, let’s break down the analytics landscape into three levels: basic, intermediate, and advanced.

Basic Level

Basic tools are perfect for understanding your core metrics without getting overwhelmed by advanced features. These tools are typically free or low-cost, user-friendly, and require minimal technical setup. They’re ideal for solo entrepreneurs, small teams, or anyone seeking actionable insights quickly without a steep learning curve.

For example, Shopify Reports offer detailed sales data and customer insights, giving new store owners a clear picture of their business performance while helping them track essential sales and traffic metrics. Meanwhile, Google Analytics 4 (GA4) provides comprehensive web analytics with eCommerce tracking, enabling businesses to monitor user behavior, traffic sources, and conversion rates in real-time.

Intermediate Level

As your business grows and your analytics needs become more sophisticated, intermediate tools offer the perfect balance of power and usability. These platforms provide more advanced segmentation, custom reporting, and integration capabilities while remaining accessible to non-technical users. They are ideal for established stores seeking deeper insights without the complexity of enterprise-level solutions.

For instance, Klaviyo excels at advanced email marketing analytics with detailed customer segmentation and lifetime value tracking, helping you target and retain your most valuable customers. Looker Studio allows you to create customizable, interactive dashboards that integrate data from multiple sources, giving you a comprehensive view of your performance. Meanwhile, Power BI offers robust business intelligence features, including rich data visualization and advanced analytics, empowering you to uncover trends and make data-driven decisions with confidence.

Advanced Level

Advanced tools are designed for businesses that require comprehensive analytics across multiple channels, complex data modeling, and enterprise-level reporting. These platforms offer powerful customization, advanced statistical analysis, and the capability to process large volumes of data from diverse sources. While they often require dedicated technical resources or specialized training, they provide unmatched depth and precision in analytics.

For example, combining Google Analytics 4 (GA4) with BigQuery allows businesses to perform advanced data warehousing and run complex queries on large datasets, unlocking deeper insights. Adding a server-side tracking stack further enhances data accuracy and reliability by capturing user interactions directly on the server, reducing data loss caused by browser limitations or ad blockers.

Choosing the right analytics tools is like picking the right shoes—it’s all about fit, comfort, and where you’re headed. Remember, tools alone won’t drive growth without clean, reliable data feeding them.

Valuable insights!

Consolidating data from disparate sources into a single “source of truth” improves decision-making, streamlines workflows, and reduces costly errors caused by fragmented or inconsistent data.

But when you’ve outgrown DIY analytics and want the next level of insight and efficiency, that’s the moment you know it’s time to bring in analytics experts. Let’s explore when and why tapping into that expertise can be a game-changer.

When It’s Time to Bring in Analytics Experts

As your eCommerce business grows, there comes a moment when your built-in dashboards and DIY analytics start to feel limiting. If your current tools and in-house efforts are leaving you with more questions than answers, it might be time to bring in analytics experts.

Here are some clear signs you’ve outgrown your built-in dashboards:

Built-In dashboard

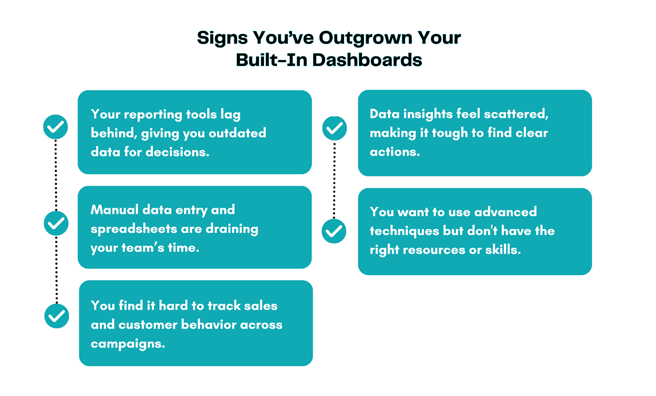
If you’re nodding along to these signs, it’s time to admit that your DIY dashboards have taken you as far as they can. Now, you need more than data; you need clarity, speed, and strategy. That’s where ZealousWeb can help.

When you Outsource Your Data Analytics, you skip the trial-and-error and tap straight into expert knowledge, custom dashboards, predictive insights, and clean data pipelines. Our White‑Label Analytics Services let you deliver enterprise‑grade reporting under your own brand, without adding a full‑time analyst to the payroll. Either way, you save time, gain sharper insights, and free your team to focus on growing the business while we handle the heavy lifting behind the scenes.

Conclusion

Guesswork is one of the biggest growth-killers in eCommerce. Without actionable analytics, you risk wasting ad spend, missing sales opportunities, and misreading your customers. Real data turns every decision into a targeted, revenue‑driving move instead of a gamble. Relying on data analyst experts can help with faster decisions, better conversion rates, lower acquisition costs, and more repeat customers.

At Zealousweb, we make that shift simple. Our Free Analytics Consultation is your chance to see how smarter tracking and insights can unlock measurable growth for your store. No fluff, no jargon—just a clear plan to turn your data into sales.

FAQs

What are the biggest challenges in implementing eCommerce analytics?

How can eCommerce analytics improve customer segmentation?

What role does predictive analytics play in eCommerce growth?

What are the best practices for maintaining data privacy while using eCommerce analytics?

How often should eCommerce stores review and update their analytics strategy?

Related Blog Posts

eCommerce analytics tools

GA4, Power BI, and Looker Studio: A Comparative Guide to the eCommerce Analytics Toolkit

September 11, 2025
data visualizationeCommerce analyticsLooker StudioPower BI
attribution tracking for eCommerce

How to Make Sure You’re Getting Credit for Every Sale Online

September 09, 2025
ad spend optimizationConversion trackingDigital MarketingServer-side tracking
Ecommerce tracking

Should You Track Store Data With Server-Side or Client-Side Tracking?

September 01, 2025
Client-side trackingConversion trackingeCommerceServer-side tracking
track sales sources

How to Track Where Your Sales Come From

August 25, 2025
eCommerce GrowthMarketing AnalyticsSales trackingUTM tracking
Custom BI dashboards

Creating Custom BI Dashboards for Finance, Marketing & Sales Teams

August 08, 2025
custom dashboardsData AnalyticsData Visualization Toolsteam collaboration
Secure Data Transfers

How to Manage Secure Data Transfers in Analytics Projects

August 04, 2025
Analytics Data ProtectionData AnalyticsData Privacy ComplianceData Transfer
Healthcare Data Analytics in Modern Care

The Future of Healthcare Data Analytics: Key Applications, Compliance, and Patient Privacy

August 01, 2025
Data AnalyticsHealthcare ComplianceHealthcare MarketingPatient Privacy
Data analytics impact

The True Cost of Not Using Data Analytics in Your Organization

August 01, 2025
Analytics StrategyBusiness OptimizationData AnalyticsDigital Marketing
Google Analytics 4 Strategy - Data Analytics by ZealousWeb

The Role of GA4 in a Modern Data Analytics Strategy

July 31, 2025
Cross-Platform TrackingData AnalyticsGoogle Analytics 4predictive analytics