


It’s 2025, and if you’re still relying on spreadsheets to track your affiliate marketing performance, it’s time to reconsider your choice. Managing multiple data sources and metrics manually can be overwhelming and inefficient. Affiliate analytics dashboards consolidate all your key data into a single, centralized space, saving you time and providing clear, actionable insights.
With a dedicated analytics dashboard, you can track performance in real-time, monitor your ROI, and identify opportunities for optimization—all in one place. From conversion rates to click-through rates (CTR), dashboards make it easier to stay on top of what matters most for your affiliate campaigns.
This blog will guide you step by step on how to build your affiliate analytics dashboard. By the end, you’ll have a tool that not only tracks your data but helps you make smarter, data-driven decisions to scale your affiliate marketing efforts.
What is an Affiliate Analytics Dashboard?
An affiliate analytics dashboard is a powerful tool that consolidates all your affiliate marketing data into a single platform. It allows marketers to easily track key performance metrics, providing a real-time overview of how campaigns are performing. By visualizing complex data in the form of charts, graphs, and tables, the dashboard enables marketers to make data-driven decisions quickly. It helps turn raw numbers into actionable insights, allowing for more straightforward interpretation and optimization of campaigns.
While manual tracking was a helpful method in the past, it came with its own set of challenges. As campaigns grew, managing data across multiple spreadsheets and platforms became time-consuming and error-prone. To highlight these differences, take a look at the table below:
| Aspect | Affiliate Analytics Dashboard | Manual Tracking |
| Real-time updates | Instant updates for making timely, data-driven decisions. | Delayed data, requiring waiting for reports. |
| Data consolidation | All key metrics in one platform for easy access and analysis. | Data is scattered across multiple platforms and spreadsheets. |
| Visualization | Graphs, charts, and tables offer quick and precise insights. | Raw numbers make it hard to spot trends or take action. |
| Automation | Automatically updates data, saving time and effort. | Requires manual entry and regular updates, prone to human error. |
As you can see from the comparison, the affiliate analytics dashboard simplifies data tracking, optimizes decision-making, and saves valuable time, making it an essential tool for scaling your affiliate marketing efforts efficiently.
Why Use an Affiliate Analytics Dashboard?
In affiliate marketing, data is everything, and dashboards provide the tools necessary for affiliates to track performance, make adjustments, and keep customers engaged. According to recent statistics, affiliates using dashboards for tracking report a 5% better retention rate compared to those who don’t. This alone highlights the impact of using a dedicated dashboard for managing your campaigns.
But the benefits go far beyond just retention rates. Let’s dive into why using an affiliate analytics dashboard can transform the way you approach your campaigns and maximize your marketing efforts:
Streamlining Data Collection
Manual tracking often means jumping between different platforms and spreadsheets, which can be time-consuming and prone to errors. With affiliate analytics dashboards, all your key data from affiliate networks, advertising platforms, and sales tracking tools come together in one place. These dashboards integrate real-time data from multiple sources, allowing you to track key metrics in a single view. This saves you valuable time, ensures accurate data, and allows you to focus more on campaign optimization rather than spending hours cleaning and organizing data.
Real-Time Performance Tracking
One of the most significant advantages of an affiliate analytics dashboard is its ability to track performance in real time. You no longer have to wait for reports to see how your campaigns are doing. With dashboards, key metrics are updated instantly, providing a clear picture of performance as it happens. This allows you to quickly identify issues, such as sudden drops in conversions or spikes in traffic, and adjust your campaigns or budgets on the spot to make sure you’re getting the best return on investment.
Improving Decision-Making and ROI
Affiliate analytics dashboards offer clear visualizations of essential data, enabling you to make informed decisions more quickly. With easy-to-read graphs and charts, you can track metrics. The dashboard enables you to segment and filter your data in real-time, allowing you to analyze performance by device, location, or even individual affiliate partners. This allows you to spot trends, scale successful campaigns, and quickly identify areas for improvement, ultimately boosting ROI and campaign effectiveness.
Enhancing Campaign Efficiency with Data-Driven Insights
A well-designed affiliate analytics dashboard consolidates complex data into a clear and concise format, enabling you to make smarter, data-driven decisions that enhance campaign efficiency. Dashboards often include predictive analytics, which helps identify trends before they become apparent. This can guide your strategy, allowing you to focus on the most promising areas of your campaigns. Additionally, dashboards integrate with A/B testing tools, making it easy to see the impact of changes you’ve made and adjust your approach for optimal results without waiting for long feedback loops.
Now that you understand the advantages of using an affiliate analytics dashboard, let’s look at the steps that will guide you in building your dashboard. But before we dive into the steps, here are some key questions our in-house data analysts want you to answer:
Q1: What metrics should you track?
- Think about the KPIs that matter most to your goals.
Q2. What data is most valuable to your affiliates and clients?
- Identify what insights will help them perform better.
Q3. Who will use this dashboard, and how can it be tailored to meet their needs?
- Tailor it for the right audience—whether it’s your team, affiliates, or clients.
Q4. How will you measure the success of your dashboard?
- Define how you’ll track its effectiveness.
How to Create an Affiliate Analytics Dashboard: Step-by-Step
Building an affiliate analytics dashboard might seem like a complex task, but with the right approach, it can be an easy and effective way to track your campaign performance. Below, we break down the process into clear, actionable steps.
Step 1: Choose the right platform
The first step is to decide which platform you’ll use to build your dashboard. The platform you choose will impact how easily it integrates with various data sources and how customizable the dashboard can be. Here are a few popular options:
- Google Data Studio: Ideal for beginners, it’s free and integrates well with Google Analytics, Google Ads, and other Google services. It’s perfect for creating basic yet effective dashboards that are easy to share and collaborate on.
- Tableau: Excellent for creating advanced visualizations. It’s a good option if you need to work with large datasets or require more complex reporting. Tableau’s drag-and-drop interface makes building a dashboard intuitive, though it may have a steeper learning curve.
- Power BI: An excellent option for Microsoft users. Power BI integrates seamlessly with Excel, Azure, and other Microsoft tools. It’s ideal for users who are comfortable working in the Microsoft ecosystem and need more advanced data modeling and reporting features.
Pro Tip
Choose a platform that grows with you—pick a tool that fits your current needs but also has the flexibility to scale as your affiliate program expands.
Step 2: Connect your data sources
Once you’ve chosen a platform, it’s time to integrate your data sources. Affiliate marketers usually rely on data from multiple platforms, including:
- Affiliate networks: Most affiliate networks offer APIs or integration options that allow you to pull real-time performance data directly into your dashboard. Connecting these networks allows you to monitor affiliate performance, track commissions earned, and measure each affiliate’s contribution to your sales.
- Sales platforms: Whether you use any e-commerce platform, integrating your sales data is essential for tracking the revenue generated from affiliate-driven traffic. This allows you to easily track which affiliates are driving the most sales and calculate your return on investment (ROI) more accurately.
- Ad platforms: Linking your ad platforms to your analytics dashboard, you can track the performance of paid ads alongside affiliate-driven traffic. This allows you to assess the performance of your ads, see where your spend is going, and align it with affiliate marketing efforts.
- Web Analytics: Integrating web analytics tools into your dashboard, you can monitor traffic patterns, bounce rates, session duration, and conversion paths. This data is crucial for understanding how affiliate traffic interacts with your site and whether it converts into sales.
- Email Marketing Platforms: If you use email marketing campaigns as part of your affiliate marketing strategy, integrating platforms like Mailchimp or Klaviyo can help track the performance of affiliate-driven email campaigns.
Pro Tip
The more integrated, the better—make sure your data sources sync smoothly with your platform, so you’re always working with real-time, accurate information.
Step 3: Define and organize the key metrics
The sole purpose of the affiliate analytics dashboard is to provide you with the data that matters most for improving your affiliate marketing efforts. Here’s a list of essential metrics:
- Conversion Rate (CR): CR tells you how effective your affiliate program is at turning visitors into paying customers. Track the conversion rate of each affiliate to determine which ones are driving the best results.
- Click-Through Rate (CTR): The CTR measures the percentage of people who click on your affiliate links compared to the total number of times your links are displayed. A low CTR could indicate that your ad creatives or offers need optimization. A high CTR, however, signals effective engagement.
- Earnings Per Click (EPC): EPC helps you understand how much revenue you are generating from each click. It’s beneficial for comparing affiliate offers and optimizing affiliate commissions.
- Revenue Per Affiliate: By tracking the revenue each affiliate generates, you can identify your top performers. This metric helps you decide where to focus your attention and resources.
- Customer Lifetime Value (CLTV): Understanding the long-term value of customers acquired through affiliate marketing will help you optimize your campaigns for higher-quality leads that will continue to bring in revenue over time.
Pro Tip
Focus on what drives growth—track the metrics that directly impact your ROI. Prioritize performance metrics, such as EPC and CR, to keep your efforts focused and results-oriented.
Step 4: Design your dashboard for clarity and simplicity
The design of your dashboard should be well-organized, and an easy-to-read dashboard ensures you can quickly understand your performance metrics and make informed decisions. Here’s how to design an effective affiliate analytics dashboard:
- Simplicity is key: Use clear and simple visualizations, such as bar charts, line graphs, and pie charts, to effectively display data. This enables you to grasp trends quickly without being overwhelmed by excessive information.
- Logical Layout: Group related data points together. For example, keep traffic data (clicks, CTR) separate from revenue-related metrics (EPC, conversions). This makes the dashboard more straightforward to navigate and helps you find insights more quickly.
- Customizable Views: Allow users (or yourself) to tailor the view to meet specific needs. Providing users with the ability to filter and select what they want to see can make your dashboard more versatile and user-friendly.
- Highlight Key Metrics: Place your most important metrics at the top or in prominent positions on the dashboard. This ensures that decision-makers can immediately spot the data they need to take action.
Pro Tip
Simplicity leads to clarity—keep your dashboard clean and easy to navigate. The simpler the design, the faster you can identify trends and make decisions.
Step 5: Set up automatic data updates and real-time tracking
To make your affiliate analytics dashboard truly effective, it must update automatically and provide real-time tracking. This ensures that the data you’re working with is always up to date, helping you make quick, data-driven decisions. Here’s how to set it up:
- Automatic Data Syncing: Connect your dashboard to data sources that update automatically, keeping your insights fresh and actionable at all times. It helps to pull data directly and update in real-time, so you don’t have to refresh it manually.
- Real-Time Performance Tracking: Set up real-time performance tracking to monitor changes as they happen. This includes tracking live traffic, conversion rates, and ad performance in real-time, allowing you to adjust campaigns instantly as needed.
- Set Up Alerts and Notifications: Implement alerts for when specific metrics fall below or exceed your set thresholds. Setting up an automatic alert can notify you to investigate and take action immediately.
- Integration with A/B Testing Tools: Ensure that your dashboard is integrated with A/B testing tools to track the results of tests on your affiliate offers, ad creatives, and landing pages. This integration will enable you to optimize your approach based on the data.
Pro Tip
Automate for efficiency—setting up real-time updates means you’ll always be working with fresh data, allowing you to take immediate action and avoid costly delays.
Building your affiliate analytics dashboard is a significant first step, but to make it work for you, it’s essential to have the right experts by your side. Data analysts can help you make sense of all the data and set things up just right.

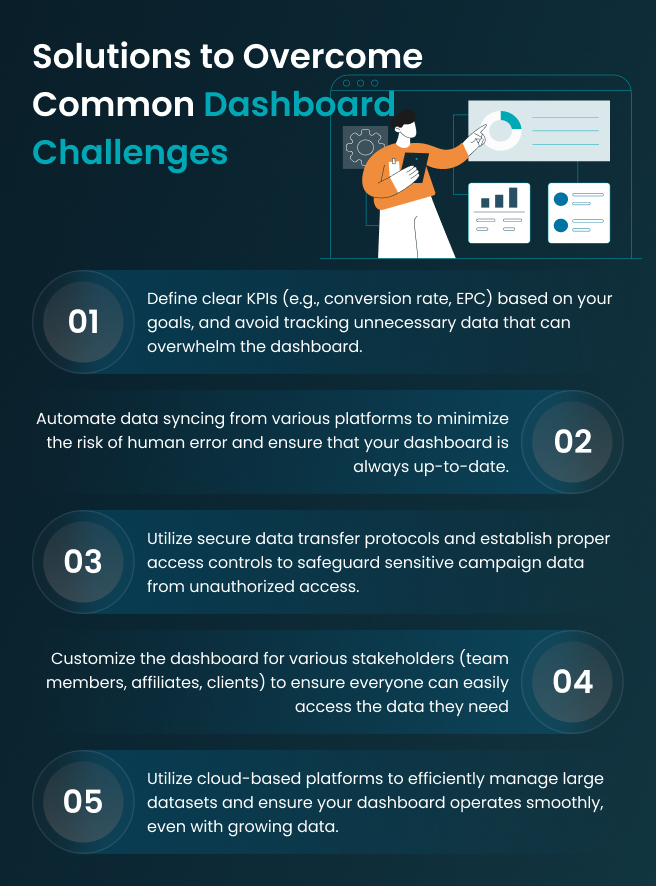
Common Challenges When Creating an Affiliate Analytics Dashboard
Building an affiliate analytics dashboard is a crucial step for optimizing your affiliate marketing strategy, but the process comes with its own set of challenges. These challenges can complicate the setup of the dashboard and impact its functionality. Here are some of the common obstacles affiliate marketers face:
Integrating Multiple Data Sources
Affiliate marketers often rely on a mix of platforms to track different aspects of their campaigns. However, integrating data from all these diverse sources into a single, cohesive dashboard can be a complex task. Each platform may have its own data format, tracking methods, or attribution models, which can create friction when trying to consolidate the data.
Without seamless integration, you risk misaligned data that doesn’t provide a complete picture of campaign performance.
Ensuring the Dashboard is User-Friendly
A well-designed dashboard is only effective if users can easily navigate and interpret it. Marketers often struggle with organizing the dashboard in a way that’s intuitive for different stakeholders. Too many metrics or overly complex visualizations can overwhelm users, making it challenging to extract meaningful insights.
A dashboard should strike a balance between comprehensiveness and clarity, offering easy access to essential data without being cluttered or complicated.
Overcoming Data Inconsistencies or Missing Information
One of the most frustrating challenges when building a dashboard is dealing with data inconsistencies or missing information. Since affiliate programs, ad platforms, and sales tools often track data in different ways, discrepancies can arise. For example, one platform might track conversions differently from another, or data might be missing altogether due to tracking errors or API limitations.
This makes it hard to rely on the dashboard’s insights, as inaccurate or incomplete data can lead to poor decision-making and misinformed campaign adjustments.
Ensuring Accuracy and Reliable Performance Tracking
For an affiliate analytics dashboard to be truly effective, it must provide accurate, real-time performance tracking. If the data feeding into your dashboard is incorrect or not updated promptly, it can lead to misleading metrics. Affiliate marketers often struggle with ensuring reliable tracking, especially when integrating multiple data sources.
Performance metrics must be tracked consistently across all platforms for accurate reporting. If any data source fails to sync properly, it compromises the overall reliability of the dashboard. We’ve highlighted the challenges; let’s explore the practical solutions to help you create an efficient affiliate analytics dashboard.
7 Examples of Affiliate Analytics Dashboards and Their Uses
When it comes to affiliate analytics dashboards, the right dashboard depends on your specific needs and goals. Below are seven types of dashboards and how they can help improve your campaigns:
Performance Dashboards
A performance dashboard is the go-to tool for affiliate networks. It gives a comprehensive overview of how campaigns, affiliates, and offers are performing in real-time. These dashboards typically include metrics such as clicks, conversions, commissions, and overall campaign health. This type of dashboard enables network managers to monitor overall performance, identify top-performing affiliates, and make informed, data-driven decisions for scaling successful campaigns.
Conversion Tracking Dashboards
Conversion tracking dashboards focus on measuring the effectiveness of affiliate offers in converting website visitors into customers. These dashboards are designed to track key metrics, including conversion rates, sales volume, and lead generation. By having this data at hand, marketers can see exactly how well their affiliates are driving results and identify underperforming offers or affiliates. It enables you to zoom in on sales performance, allowing you to refine your strategies and improve ROI based on conversion data.
Geographical Analysis Dashboards
Geographical analysis dashboards provide insights into the location of your affiliate traffic. These dashboards allow you to see where your clicks and conversions are coming from, making it easy to identify strong regions and areas that may need further targeting. This is especially useful for region-based campaigns, where understanding geographic performance is key to optimizing ad spend. It helps marketers target specific regions with customized campaigns, ensuring they reach the right audience in the right areas, leading to improved campaign efficiency.
Revenue Attribution Dashboards
A revenue attribution dashboard is used to track the performance of different affiliate marketing channels, ad platforms, and campaigns. This dashboard enables marketers to see how each action contributes to the overall revenue. Metrics and attribution models are central to these dashboards. It helps you understand the exact ROI of each affiliate and marketing channel, ensuring that budget allocation is optimized for the best-performing channels.
Click Fraud Detection Dashboards
As click fraud becomes increasingly sophisticated, click fraud detection dashboards are essential for safeguarding affiliate marketing budgets. These dashboards track click patterns, IP addresses, and conversion ratios to spot fraudulent behavior. Metrics like high click-through rates (CTR) with low conversions or repetitive clicks from the same IP address are red flags. It actively identifies and blocks suspicious activity, ensuring your campaigns aren’t wasting money on fraudulent clicks and protecting your overall ad spend.
Traffic Analysis Dashboards
Traffic analysis dashboards offer valuable insights into how users interact with your website or affiliate links. These dashboards track session duration, bounce rates, and user flow, enabling you to understand how affiliate-driven traffic interacts with your site. This is vital for identifying potential friction points and improving conversion rates. By analyzing audience behavior, you can optimize the user experience, remove barriers, and increase conversions from affiliate traffic.
Affiliate Performance Dashboards
Affiliate performance dashboards are essential for tracking individual affiliate performance. These dashboards allow you to see which affiliates are driving the most traffic, generating the most conversions, and earning the highest commissions. By understanding affiliate performance, you can reward top affiliates and identify opportunities for improvement with others. It provides a clear picture of each affiliate’s performance, making it easier to optimize relationships and ensure that top performers are rewarded.
While these affiliate analytics dashboards provide a visually appealing understanding of the data, making actionable decisions requires a more in-depth analysis. To gain those valuable insights and draw meaningful conclusions, you need the support of data analytics services. Data analytics services leverage the latest advancements in AI and machine learning to deliver more detailed insights, automate decision-making processes, and streamline workflows for optimal efficiency.

Conclusion
This blog has covered a wide range of technical details, which may feel overwhelming to digest. However, don’t worry—this guide is designed to serve as your step-by-step blueprint for building your affiliate analytics dashboard.
To make things easier, start by getting a quick 60-second estimation report. This will provide you with a snapshot of your current data, potential fraud risks, and opportunities for optimization, laying the foundation for your dashboard. From there, you can start building with confidence and take complete control of your affiliate marketing efforts.
FAQs
How Can an Affiliate Analytics Dashboard Help Optimize Campaigns?
By consolidating all campaign data in one place, a dashboard helps you quickly identify top-performing affiliates, high-ROI campaigns, and underperforming areas. These real-time insights allow you to adjust strategies promptly and improve conversions.
How Do I Know If an Affiliate Analytics Dashboard Is Right for My Business?
An affiliate analytics dashboard is ideal if you manage multiple campaigns or affiliates and find manual tracking time-consuming. It centralizes key metrics, helps you compare spending versus earnings, and enables faster, more informed optimization decisions.
How Can I Ensure the Data Displayed on My Dashboard Is Accurate and Up to Date?
Accuracy depends on using reliable tools and real-time integrations. Connect your dashboard directly to affiliate networks and ad platforms, enable automatic data syncing, and regularly audit data sources and tracking settings to prevent errors or inconsistencies.
How Can I Customize My Affiliate Analytics Dashboard for Different Stakeholders?
You can tailor an affiliate analytics dashboard to show only the data each stakeholder needs. For example, affiliates may focus on commissions and individual performance, while internal teams may track ROI and campaign trends. Custom views ensure every stakeholder gets clear, relevant insights without unnecessary clutter.
Can I Scale My Affiliate Marketing Efforts Using an Analytics Dashboard?
Yes. A dedicated affiliate analytics dashboard helps you track performance, identify top-performing campaigns, and quickly spot underperforming areas. This enables smarter resource allocation, easier scaling, and consistent data-driven growth.


