As businesses increasingly rely on data to drive their strategies, the ability to transform raw data into actionable insights has become a key competitive advantage. However, this requires more than just data collection; it demands the right approach to analytics. Thomas H. Davenport, an American academic and author specializing in analytics and business process innovation, argues, ‘Without data, you’re just another person with an opinion.‘ This quote underscores the importance of not only collecting data but also understanding its context. Businesses often face the dilemma of choosing the right type of data analytics.
One of the most common discussions is between the top two types: Descriptive vs. Diagnostic analytics. Both play pivotal roles in helping decision-makers better understand their data, but each serves a unique purpose. Businesses can make more informed, data-driven decisions, refine their strategies, and ultimately drive growth if they understand the real difference between these two.
This blog will explore the key differences between descriptive and diagnostic analytics, providing decision-makers with the insights they need to select the most suitable approach for their business needs.
Understanding Descriptive Analysis
Descriptive analysis is the process of summarizing historical data to uncover trends, patterns, and insights that can guide business decisions. It answers the “what happened” by focusing on past data, presenting it clearly and understandably to highlight key trends or performance metrics.
To effectively perform descriptive analytics, a range of methods and tools are employed to transform raw data into actionable insights. These methods help businesses organize and summarize their data, making it easier to spot trends, measure performance, and understand past behavior. Below are some of the key methods and tools used in descriptive analytics that can help you visualize and analyze your data efficiently.
Method/Tool | Description | Tools/Examples |
Statistical Measures | Uses metrics like mean, median, mode, and standard deviation to summarize data. | Excel, Google Sheets |
Data Visualization | Presents data trends and patterns using graphs, charts, and dashboards. | Tableau, Power BI |
Data Aggregation | Summarizes and groups large datasets to provide actionable insights. | SQL, Python (Pandas) |
Time Series Analysis | Analyzes data points collected over time to identify trends and patterns. | Excel, R, Python (Statsmodels) |
Reports & Dashboards | Generates customizable reports and visual dashboards to track KPIs. | Google Analytics, Power BI |
Descriptive analytics plays a vital role in helping decision-makers make sense of vast amounts of data. Here are some key benefits of using descriptive analytics for better decision-making:
- Simplifies Complex Data: Makes large volumes of data understandable, enabling decision-makers to interpret and analyze key insights easily.
- Identifies Trends: Helps businesses recognize recurring patterns or trends over time, which can influence future strategy.
- Improves Reporting: Provides clear, actionable reports that assist in evaluating past performance and understanding business health.
- Supports Performance Benchmarking: Helps set benchmarks by comparing past performance, identifying areas of strength, and areas for improvement.
- Guides Strategic Decisions: By understanding historical data, businesses can forecast future performance and align their strategies more effectively with current trends.
In fact, studies show that companies using data to drive decisions are 5 times faster at making critical choices. Descriptive analysis does more than just help businesses review past data; it sets the stage for smarter, future-oriented decisions.
Understanding Diagnostic Analysis
Diagnostic analysis digs deeper into the data to uncover the reasons behind trends or patterns identified in descriptive analysis. While descriptive analysis answers the question of “what happened,” diagnostic analysis takes it a step further to answer “why did it happen?” Analyzing historical data in detail enables businesses to understand the factors that contributed to specific outcomes or events.
To perform diagnostic analysis effectively, businesses use a range of methods and tools to examine relationships, correlations, and underlying causes. Below are some key methods and tools used in diagnostic analytics to provide actionable insights.
Method/Tool | Description | Tools/Examples |
Root Cause Analysis | Identifies the underlying causes of problems or unexpected outcomes. | Excel, R, Python (SciPy) |
Correlation Analysis | Examines the relationship between two or more variables to identify the factors that influence them. | Excel, SPSS, Python (Pandas) |
Drill-Down Analysis | Breaks down data into smaller, detailed parts to explore specific causes. | Power BI, Tableau |
Hypothesis Testing | Tests assumptions about data to validate or reject theories. | R, Python (SciPy, Statsmodels) |
Regression Analysis | Examines the relationship between a dependent variable and one or more independent variables. | Excel, R, Python (Scikit-learn) |
Diagnostic analysis helps decision-makers identify the underlying causes of data trends. Let’s explore some of the key benefits of using diagnostic analytics for more informed decision-making:
- Identifies Root Causes: Helps uncover the underlying reasons for issues or outcomes, enabling more effective problem-solving.
- Improves Strategic Planning: Provides a deeper understanding of factors influencing outcomes, allowing businesses to refine strategies for better results.
- Enhances Decision-Making: With a clearer view of what’s driving the trends, decision-makers can make informed choices based on the true causes behind performance.
- Optimizes Processes: Identifies inefficiencies or bottlenecks in business processes, enabling targeted improvements.
- Supports Risk Management: By understanding the reasons behind past events, businesses can better anticipate potential risks and proactively mitigate them.
In fact, a study by McKinsey revealed that companies using diagnostic analytics are 2.5 times more likely to improve operational efficiency, demonstrating how uncovering the “why” behind data can significantly enhance decision-making.
Descriptive Vs. Diagnostic Analysis: Key Differences
Understanding the difference between descriptive and diagnostic analysis is key to making better data-driven decisions. Knowing when and how to use each type will enable you to draw more accurate insights, refine your strategies, and enhance your decision-making.
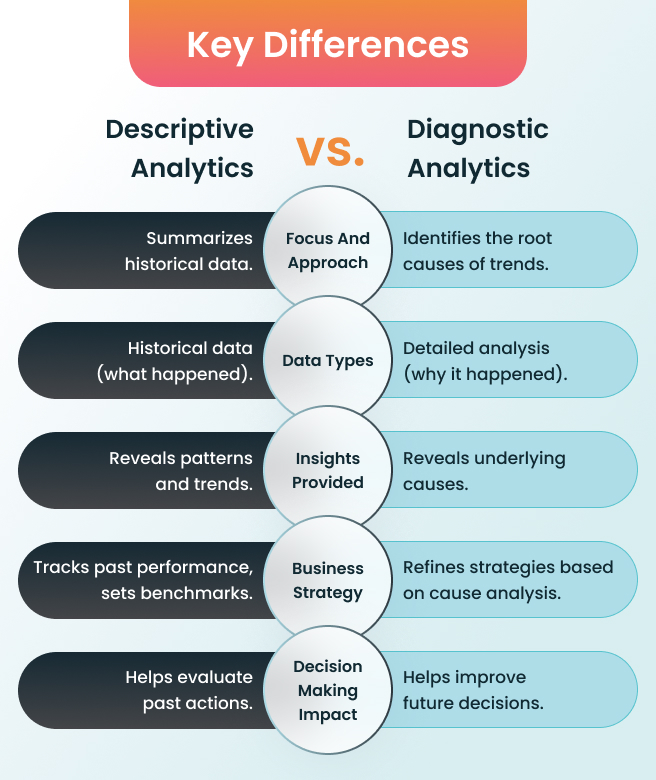
In essence, while descriptive analytics reveals past patterns, diagnostic analytics helps you uncover the reasons behind those patterns, allowing for more informed decisions moving forward.
Best Use Cases for Descriptive and Diagnostic Analysis
Both descriptive and diagnostic analysis play crucial roles in data-driven decision-making, but they shine in different scenarios. Understanding when to use each analysis type can make a significant impact on your business strategy.
Use Case for Descriptive Analysis
Descriptive analysis is best suited for summarizing and visualizing historical data. It’s most useful when you need to gain insights into past performance or understand general trends. Descriptive analytics is valuable when you need:
- To track key performance indicators (KPIs) like revenue, customer retention, or product performance.
- To create reports or dashboards that provide snapshots of past data.
- To set benchmarks and monitor performance over time.
For example, a retailer can utilize descriptive analytics to analyze past sales data, understand which products performed well, identify sales trends, and compare performance across different periods (e.g., monthly or quarterly sales).
Use Case for Diagnostic Analysis
Diagnostic analysis comes into play when you need to understand the root causes of specific outcomes. It helps explain why certain events occurred by examining the relationships between variables. Diagnostic analytics is useful when you need:
- To dive deeper into anomalies or unexpected changes.
- To explore the reasons behind business challenges (e.g., why a product failed or why sales decreased).
- To refine strategies by uncovering hidden insights about customer behavior, process inefficiencies, or market dynamics.
For example, a company noticing a sudden drop in customer retention could use diagnostic analytics to investigate the cause. By analyzing customer feedback, seasonal trends, and product or service changes, they can identify factors that influence the churn rate.
Choosing the Right Analysis for Your Business
Choosing between descriptive and diagnostic analysis impacts how you interpret past performance and uncover the underlying reasons behind trends. When deciding which analysis to use, consider the following factors that directly affect your business’s needs.
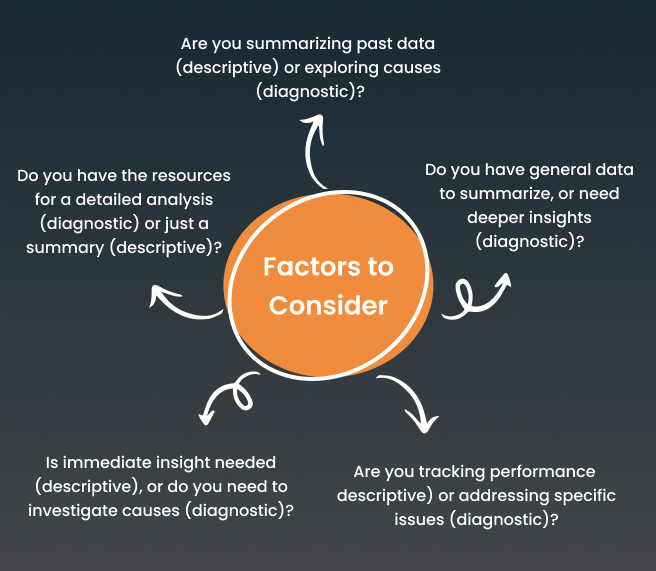
Considering these factors, the key question is which type of analytics best aligns with your business goals.
The right analysis depends on your objectives. Descriptive analysis is perfect for tracking overall performance and understanding broad trends. If your goal is to uncover the reasons behind a specific outcome, diagnostic analysis is the most effective approach for doing so.
Conclusion
Choosing the optimal analytics method is crucial to making data-driven decisions that will move your business forward. Whether you’re using descriptive analytics to track past performance or diagnostic analytics to uncover the reasons behind those trends, each serves a unique purpose. Understanding when and how to use both can provide you with a comprehensive view of your data, helping you refine your strategy and optimize your operations.
At ZealousWeb, we provide tailored analytics solutions that empower businesses to harness their data and make strategic decisions that drive growth and innovation. Schedule a 30-minute consultation today to explore how the right data analytics approach can help you make smarter, more impactful decisions for your business.