ZealousWeb
eCommerce reporting

Easy Ways to Set Up Reports to Track Your Online Store’s Success

October 09, 2025Posted By: Manjiri Bhate
Conversion OptimizationData StrategyeCommerce analyticsReporting & Dashboards

We know you’ve poured your heart into building your online store. But between juggling products, marketing, and customers, it’s easy to feel overwhelmed by numbers and reports that don’t seem to tell the whole story. If you’ve ever wondered whether there’s a more straightforward way to understand what your data means and how it can help you grow, you’re in the right place.

By 2030, global eCommerce sales are expected to reach an estimated $6,146.36 billion, with more than one in five purchases happening online. The pace of change is fast, and guessing your way forward just isn’t enough anymore.

With the right approach to reporting, backed by today’s tools like AI-driven insights and real-time dashboards, you can focus on the few key metrics that truly matter. This blog will guide you step-by-step to find those numbers, track them easily, and use them to make confident decisions that help your store thrive.

Stick with us till the end because understanding your data better could be the single most valuable thing you do for your business this year.

What Does “Tracking Success” Actually Mean in eCommerce?

Success in eCommerce doesn’t just happen; it’s tracked, measured, and built on the right insights. At its core, tracking success means measuring how effectively your online store meets its business goals by monitoring data that highlights both progress and areas for improvement.

But success is about understanding the drivers of growth and long-term profitability.

When we talk about tracking success, it’s essential to look beyond revenue. It’s defined by a mix of factors, such as:

  • Sales Performance: Track product-wise sales, conversion rates, average order value, and cart abandonments to see what’s driving growth.
  • Customer Behaviour: Monitor browsing patterns, click paths, and purchase triggers to improve user journeys and boost conversions.
  • Marketing ROI: Measure CPA, ROAS, and revenue per channel to spend budgets where they deliver the most significant returns.
  • Retention and Loyalty: Watch repeat purchases, LTV, and churn rates to turn one-time buyers into long-term customers.

Tracking these areas puts you in a position to make informed decisions that strengthen performance across the board, not just your bottom line. There are a few key KPIs worth tracking. Explore them in our 2025 KPI Guide for deeper insights.

Now, let’s move to the practical side—the tools you can use to set up your eCommerce reports effectively.

Tools You Can Use to Set Up eCommerce Reports

No matter your background, having reliable eCommerce reports is essential. Reports give you the clear, actionable insights you need to understand your store’s performance and make smarter decisions every day. Fortunately, there are plenty of tools designed to help you track, analyze, and visualize your data in ways that fit your skills and needs.

Here are the top 6 tools every eCommerce store owner should consider when setting up their reports.

Google Analytics (GA4)

Google Analytics 4 is the cornerstone for understanding your website’s traffic, user behaviors, and conversion paths. GA4 goes beyond basic page views—it tracks how visitors engage with your site through events and conversions that align with your business goals. This includes actions like product views, add-to-carts, and completed purchases, giving you a comprehensive picture of the customer journey.

To make GA4 easier to work with, set up conversion tracking early and use Google Tag Manager for seamless event tagging without heavy coding. This helps keep your data accurate and your reports meaningful from the get-go.

Shopify Reports

Shopify’s native reports provide ready-to-use insights into your store’s sales trends, product performance, and customer behavior within the Shopify ecosystem. These reports provide quick access to key data, including best-selling products, sales by channel, and customer acquisition, enabling you to react swiftly and optimize your inventory and marketing.

Use Shopify’s built-in report filters and schedule automated exports to your inbox. This hands-off approach saves time and keeps your team updated without needing advanced analytics skills.

Looker Studio (with GA4)

Looker Studio (formerly Google Data Studio) integrates seamlessly with GA4 and other data sources to create highly customizable, visual dashboards. You can combine multiple data streams—like website traffic, sales, and ad performance—into a single dashboard that’s easy to share and interpret across teams.

Start with pre-built templates tailored for eCommerce to speed up setup. Connect GA4 and other sources using connectors, so your dashboard refreshes automatically and requires minimal manual effort.

Power BI / Tableau

Power BI and Tableau are powerful business intelligence tools that provide deep data analysis and visualization capabilities suitable for enterprises or stores with complex data needs. They allow you to blend multiple datasets, create interactive reports, and perform advanced analytics to uncover trends and insights that drive strategic decisions.

For easier integration, use connectors designed for eCommerce platforms and cloud services. Automate data refresh schedules to keep your reports up-to-date without manual intervention, freeing your team to focus on analysis rather than data wrangling.

Klaviyo / Email Tools

Klaviyo and similar email marketing platforms track the performance of your email campaigns and automation funnels, showing metrics like open rates, click-through rates, and attributed revenue. This data helps you optimize your messaging and targeting to maximize customer engagement and retention.

Integrate your eCommerce platform directly with Klaviyo to sync customer and purchase data. This enables personalized email triggers based on real-time customer behavior without extra setup, making automation both powerful and easy.

Meta Ads + Google Ads Dashboards

Dashboards for Meta Ads (Facebook, Instagram) and Google Ads help you monitor the return on investment (ROI) of your paid marketing campaigns. They show you cost per acquisition, conversion rates, and revenue driven by ads, enabling you to allocate budgets efficiently and optimize campaigns continually.

Use native integrations or third-party tools that pull ad data directly into your reporting dashboards. Automate data syncing to avoid manual updates and ensure you always have the freshest insights to adjust your media strategy quickly.

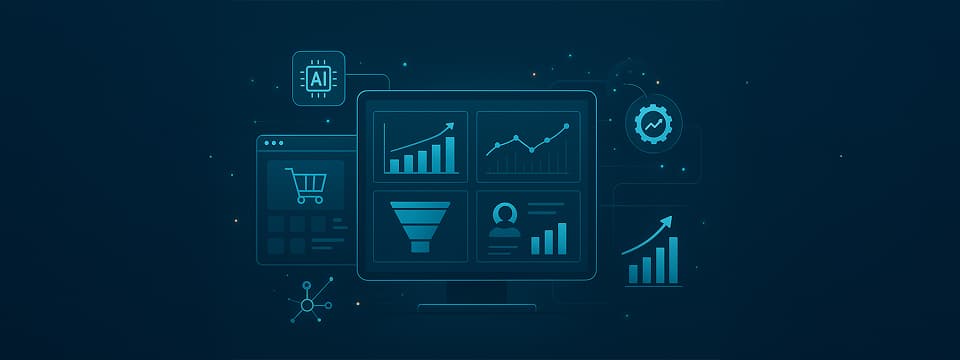
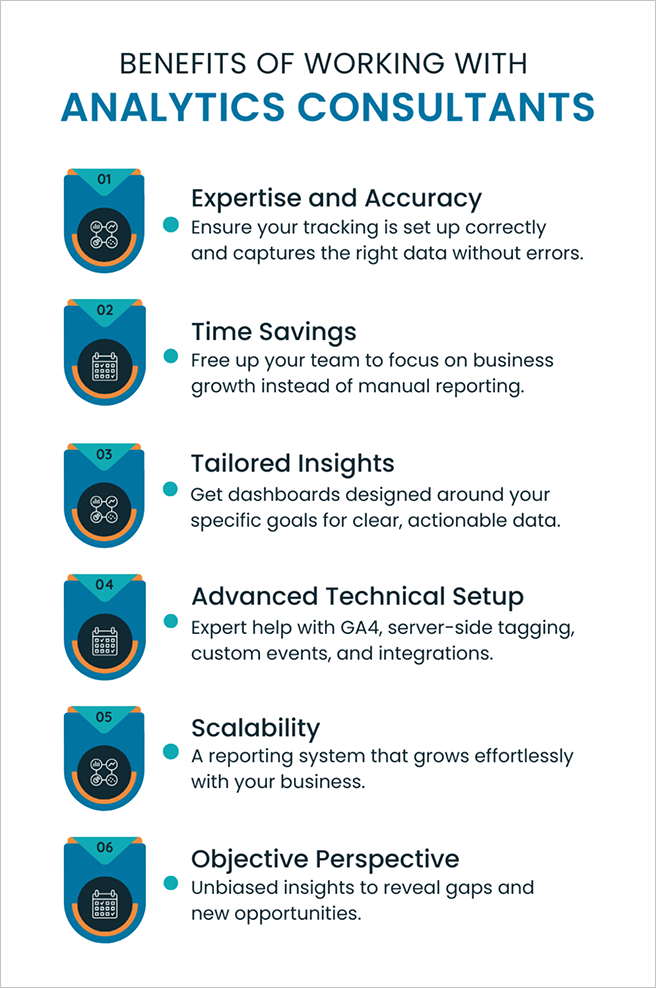
Of course, having these tools is just the first step—making sense of the data they generate and turning it into actionable strategies often requires the expertise of a skilled data analyst.

analytics

Essential Reports Every Store Should Set Up

When it comes to running an online store, some reports deliver a significant impact without needing complicated setups. Reports are essential as they help you see your store’s performance from multiple angles, like sales, customer behavior, and marketing efficiency, without drowning you in data.

These reports can be configured in a matter of minutes, yet they provide valuable insights you can act on immediately.

Sales Performance Dashboard

A Sales Performance Dashboard gives you a clear view of your store’s financial health, tracking revenue, product performance, and growth opportunities. It highlights key factors so you can spot trends, identify bestsellers, and address issues early.

A well-rounded Sales Performance Dashboard typically covers:

  • Revenue Tracking: Monitor revenue over time to measure sales velocity and campaign impact.
  • Average Order Value (AOV): See how much customers spend per order to gauge upselling success.
  • Sales by Product/Category: Identify top and underperforming products for smarter marketing and inventory.
  • Sales Trends: Plan for peaks and dips in demand.
  • Return & Refund Rates: Catch quality or service concerns quickly.

Shopify Reports provide easy access to these numbers, while GA4 adds behavioral insights leading to purchases, giving you both the metrics and the context to refine your sales strategy.

Traffic and Channel Attribution Report

A Traffic and Channel Attribution Report helps you understand not just how much traffic your eCommerce store receives, but where that traffic is coming from and how each marketing channel contributes to your sales and conversions. It goes beyond simple visitor counts to assign credit to the various touchpoints that lead customers to purchase. The tracking success depends on more than just total visits or last-click buys.

The report sheds light on:

  • Traffic Sources: Determine if visitors arrive through search, ads, social media, email, or direct visits.
  • Channel Contribution: Track how much each channel drives conversions and revenue.
  • User Journey: Map key touchpoints from first visit to final purchase.
  • Attribution Models: Use first-click, last-click, time decay, or data-driven methods to credit channels fairly.

Several tools, like Google Analytics 4 (GA4) with its attribution reports, provide these insights with customizable models to fit your store’s sales cycle and marketing mix.

Checkout Funnel or Abandonment Report

A Checkout Funnel or Abandonment Report is essential to visualize exactly where shoppers drop off during the buying process before completing their purchase. This report highlights key friction points in your checkout flow, enabling you to understand these drop-off points and help you improve the overall user experience, reduce cart abandonment rates, and ultimately increase your store’s conversion rates and revenue.

Here’s what a comprehensive Checkout Funnel report typically tracks:

  • Step-by-step Drop-Offs: Identify which stage of checkout sees the highest abandonment to target specific improvements.
  • Cart Abandonment Rate: Measure what percentage of shoppers add products but don’t complete checkout.
  • Checkout Completion Rate: Track the percentage of initiated checkouts that turn into successful purchases.
  • Error & Payment Failures: Spot technical issues, such as failed transactions or form errors, that frustrate buyers.

Tools like GA4’s enhanced eCommerce reports give you detailed funnel visualization and checkout behavior data. Shopify’s built-in reports also provide ready access to abandonment metrics, making it easier to spot trends and take action.

Customer Retention & Repeat Purchase Report

A Customer Retention & Repeat Purchase Report focuses on how well your store keeps customers coming back and driving long-term value. Tracking metrics helps you understand loyalty and develop strategies that turn one-time buyers into repeat customers.

Key aspects this report typically covers:

  • Customer Lifetime Value (LTV): Measures the total revenue a customer generates during their relationship with your store.
  • Return Rates: Track the percentage of customers who make multiple purchases over time.
  • Top Segments: Segment customers by buying behavior (e.g., frequent buyers, high spenders) to tailor retention efforts.

Tools like Klaviyo help track repeat purchase behavior within targeted email campaigns, while Shopify and Power BI provide reports and visualizations to analyze overall retention trends and segment performance.

Campaign ROI Tracker

A Campaign ROI Tracker measures the cost versus revenue performance of your marketing campaigns and channels to help you optimize your advertising spend. By tracking investments alongside returns, you can make data-driven decisions to maximize your marketing budget’s impact.

This report typically includes:

  • Cost vs Revenue per Channel: Compare how much you spend versus what you earn on channels like social ads, search, or email.
  • Campaign-Level ROI: Evaluate individual campaigns’ profitability to identify winners and underperformers.
  • Budget Allocation Insights: Use ROI data to shift spend toward the most effective channels.

Platforms like Meta Ads and Google Ads offer native dashboards to monitor ad spend and conversions. At the same time, Looker Studio lets you pull all channel data into customizable reports for precise, consolidated ROI tracking.

When it comes to eCommerce, these reports show that quick fixes can pay off big.

Fun fact!

According to Harvard Business Review, companies that use data-driven decision making are 5% more productive and 6% more profitable than their competitors.

Reporting with automation can help you get these insights served fresh and effortlessly, leaving you more time to focus on growing your store.

How to Make Reporting Easier with Automation

Reporting is essential for understanding your business, but manually collecting and analyzing data can quickly become overwhelming and time-consuming. That’s where automating your eCommerce reporting comes in; you can eliminate repetitive tasks, reduce errors, and get real-time insights without lifting a finger. Automation not only saves you time but also ensures you always have accurate, up-to-date information to make smarter decisions faster. Technology today offers innovative tools that connect your data sources, generate reports automatically, and deliver visual dashboards customized to your needs.

Here are some key ways automation can simplify and supercharge your reporting process:

  • Automatic Data Collection: Automation pulls data directly from your eCommerce platform, marketing channels, and analytics tools in real time, so you don’t have to download or aggregate spreadsheets manually. This reduces errors and ensures consistency.
  • Scheduled Reports & Alerts: Set up recurring reports sent straight to your email or team channels, and get instant alerts if key metrics drop or spike unexpectedly. This keeps you proactive without having to check dashboards constantly.
  • Customizable Dashboards: Automation platforms let you create visual, interactive dashboards that update automatically. You can tailor these to highlight the KPIs most critical for your business, making data easy to digest at a glance.
  • Enhanced Data Integration: Automation connects disparate data sources—from sales and marketing to customer service—into unified reports. This holistic view helps you understand how different parts of your business impact each other.
  • Time Savings & Efficiency: By minimizing manual work, automation frees up your team to focus on strategy and optimization instead of repetitive data handling. Faster insights mean faster, smarter decisions.
  • Improved Accuracy & Consistency: Automated processes reduce human errors common in manual reporting, so you can trust your numbers and confidently base your decisions on them.
  • Scalability: As your store grows, automated reporting systems can easily handle increased data volume and complexity without extra effort or resources.

Automation turns reporting from a tedious chore into a smooth, insightful process, giving you timely, reliable data that keeps your business ahead. But even with the best tools and technology in place, it’s easy to fall into common reporting mistakes that can cloud your insights and lead to poor decisions.

The Common Reporting Mistakes to Avoid

Reporting can get complex quickly, and even minor errors or oversights can lead to misleading insights and wrong decisions. These pitfalls often arise from a lack of effort, the complex nature of data, and the need for proper interpretation. Knowing these common mistakes and how to avoid them will help you get the most out of your reports.

Reporting mistakes

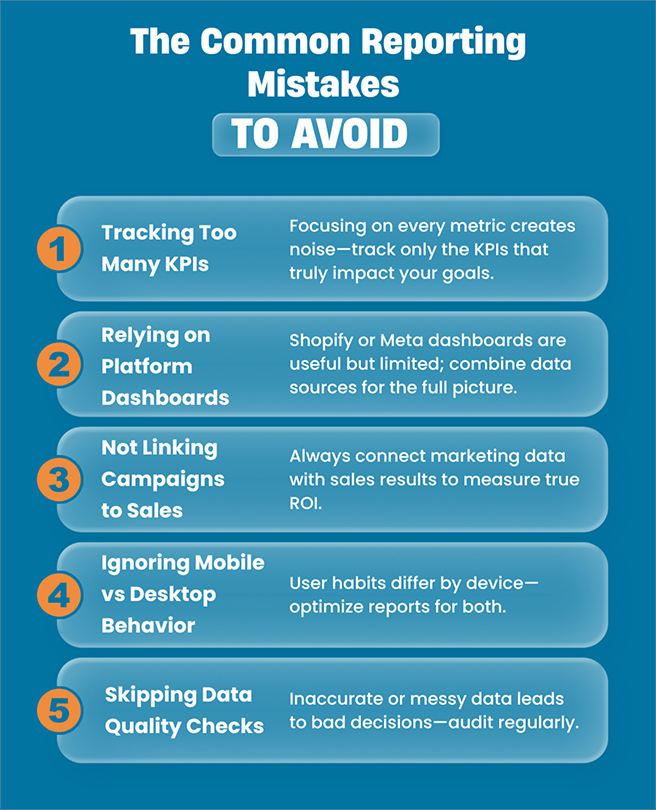
Most of these mistakes can be avoided when you partner with an expert data analytics team. They not only know how to keep your reporting accurate and focused, but also understand the difference between just having a dashboard and having a dashboard that truly drives decisions.

Examples of “Good” vs “Bad” Dashboards

There’s a surprisingly thin line between a dashboard that drives real business growth and one that’s just there.

Here’s a simple example to illustrate:

  • Bad dashboard displays “Total Page Views” and “Total Followers” prominently without explaining their connection to sales. No timelines, no segmentation, no hints on what to do next. Pretty graphs, no real impact.
  • Good dashboard highlights “Revenue by Campaign,” “Conversion Rate by Channel,” and “Customer Retention Rate”, all tied to business goals. It lets you filter by period, device, or audience segment, and indicates which campaigns are worth scaling.

Here is a quick visual comparison table for “Good vs Bad” Dashboards, highlighting their key differences:

Attribute Good Dashboard Bad Dashboard
Metrics Focus Performance-driven, goal-aligned metrics Vanity metrics with no business impact
Context Provides clear context and segmentation Lacks context, no segmentation options
Actionability Suggests concrete actions and next steps No guidance on what to do with the data
Design Clean, intuitive, and easy to interpret Cluttered or too simplified, hard to understand
User Experience Interactive with filtering and drill-downs Static, limited interactivity, and customization


The gap between a good and a bad dashboard can mean the difference between smart growth and wasted effort. A good one guides your next move; a bad one just looks pretty. If building it yourself feels overwhelming, outsourcing your reporting setup could be your smartest move. Experts can craft goal-driven dashboards that deliver real, actionable insights without the DIY headache.

When Should You Outsource Reporting Setup?

Initially, many store owners manage their reporting to keep things simple and hands-on. But as your business grows and your data needs become more complex, trying to do everything yourself can quickly become overwhelming. Outsourcing your reporting setup to experts can save you time, reduce errors, and provide deeper insights, helping you focus on what you do best: growing your store.

That said, here are some clear signs you’ve outgrown DIY reporting and it might be time to bring in the pros:

  • You’re spending more time wrangling data than running your business.
  • Your reports are delayed or inconsistent, causing missed opportunities.
  • You struggle to connect marketing campaign data with actual sales results.
  • Your dashboards don’t provide actionable insights or clear context.
  • You need advanced integrations across multiple platforms but lack the technical expertise.
  • As your data volume grows, your current systems slow down or become unreliable.

Specifically, the GA4 setup can become particularly tricky when you move beyond basic tracking. Configuring custom events, implementing server-side tracking, or integrating multiple platforms often requires specialized skills and ongoing maintenance to ensure data accuracy and compliance.

Partnering with professional analytics consultants can transform how you manage and use your eCommerce data. Here’s why it’s a valuable investment:

Analytics consultant

This list can go on and on, but the easiest way to know exactly where you stand and what you need to do next is to hop on a free 30‑minute consultation call with an expert data analyst. In that quick chat, we’ll help you figure out your current reporting stage and the smartest steps to take going forward.

Conclusion

We hope this blog has given you fresh clarity on how powerful proper reporting can be for your eCommerce growth. From spotting bottlenecks to uncovering your best‑performing channels, a well‑structured report isn’t just numbers on a screen—it’s your decision‑making compass, guiding every smart move.

And here’s the best part—you don’t need a massive data team to unlock these insights. All it takes is the proper reporting setup that keeps delivering value, day after day. Put your data in the hands of ZealousWeb’s analytics experts. Start with a Reporting Audit today and get dashboards built to convert.

FAQs

What key challenges should businesses watch for in eCommerce reporting?

How can data from multiple sources be combined for better eCommerce insights?

Which visualization types work best for eCommerce reports?

How does automation improve eCommerce reporting accuracy and efficiency?

What benefits do analytics consultants bring to eCommerce reporting?

Related Blog Posts

eCommerce data analytics

What Is eCommerce Data Analytics & Why Your Store Needs It in 2025?

October 06, 2025
Data-Driven MarketingeCommerce Data AnalyticsGA4 for eCommerceOnline Store Growth
Set up Google Analytics 4

How to Set Up Google Analytics 4 for Your Online Store

September 29, 2025
Data Analytics for eCommerceeCommerce Tracking SetupGA4 SetupOnline Store Tracking
analytics consultant for eCommerce

What Will a Good Analytics Consultant Do for Your Store?

September 17, 2025
analytics consultantBusiness Intelligencedata insightseCommerce Growth
eCommerce analytics tools

How Analyzing Your Store’s Data Helps You Sell More Online

September 15, 2025
Data-Driven DecisionseCommerce analyticsLooker StudioPower BI
eCommerce analytics tools

GA4, Power BI, and Looker Studio: A Comparative Guide to the eCommerce Analytics Toolkit

September 11, 2025
data visualizationeCommerce analyticsLooker StudioPower BI
attribution tracking for eCommerce

How to Make Sure You’re Getting Credit for Every Sale Online

September 09, 2025
ad spend optimizationConversion trackingDigital MarketingServer-side tracking
Ecommerce tracking

Should You Track Store Data With Server-Side or Client-Side Tracking?

September 01, 2025
Client-side trackingConversion trackingeCommerceServer-side tracking
track sales sources

How to Track Where Your Sales Come From

August 25, 2025
eCommerce GrowthMarketing AnalyticsSales trackingUTM tracking
Custom BI dashboards

Creating Custom BI Dashboards for Finance, Marketing & Sales Teams

August 08, 2025
custom dashboardsData AnalyticsData Visualization Toolsteam collaboration