You didn’t launch your online store just to get buried in spreadsheets, did you?
In 2025, the most successful eCommerce brands are those that can read their own story, not just their sales receipts. Data analytics has helped store owners transform overwhelming volumes of data into actionable insights that guide informed decision-making. Believe it or not, data-driven organizations are now 19 times more likely to be profitable than those flying blind.
However, the reality for many businesses is quite different. Vast, complex dashboards often breed more confusion than confidence. While store owners may have access to abundant data, they frequently lack a clear roadmap to interpret it and take meaningful action. This paradox turns analytics into both a powerful asset and a frustrating challenge.
This is precisely where this blog aims to make a difference. By cutting through the noise and untangling the complexity, we will guide you in selecting the right analytics tool, so you can uncover the insights that truly matter.
Meet the Tools: GA4, Power BI & Looker Studio
With thousands of analytics platforms competing in the marketplace, three industry leaders consistently stand out: Google Analytics 4 (GA4), Power BI by Microsoft, and Looker Studio. Each brings its strengths to the table, serving as the backbone for millions of high-growth online businesses worldwide.
The data speaks volumes about their influence: as of 2025, Google Analytics is powering insights for over 55% of all websites globally. Power BI, meanwhile, is the trusted business intelligence engine for 97% of Fortune 500 companies. At the same time, Looker Studio is favored by startups, agencies, and small to medium-sized businesses, offering a powerful yet accessible platform that connects to more than 800 data sources.
To get a solid grasp of what each tool offers and how they differ, let’s take a closer look at these three analytics powerhouses.
- Google Analytics 4 (GA4) is the go-to for understanding website visitor behavior, tracking events, and revealing marketing funnel performance—all with a free, user-friendly interface.
- Power BI is designed for organizations that require in-depth business intelligence, enterprise-ready dashboards, and advanced data visualizations from multiple sources. It’s best suited for teams that want to see the broader operational picture and make strategic decisions with confidence.
- Looker Studio focuses on democratizing data for marketers and non-technical users, offering flexible, drag-and-drop dashboards and seamless integration with marketing and sales platforms. Its simplicity empowers teams to quickly create actionable reports without needing a coding background.
These three analytics tools are leaders that set the standard for performance, clarity, and versatility in modern e-commerce. As we move through this blog, you’ll discover which one matches your online store’s ambitions, skills, and growth strategy.
To help you make a quick decision, here’s a brief comparison highlighting their key differences.
Tool | Best For | Cost | Skill Level |
Google Analytics 4 | Tracking website traffic and user events | Free | Intermediate |
Power BI | Building deep, customizable performance dashboards with multi-source data integration | Paid (Pro) | Advanced |
Looker Studio | Creating marketing and channel-specific reports with easy drag-and-drop dashboards | Free | Beginner to Intermediate |
This table provides a foundational overview of the core differences between GA4, Power BI, and Looker Studio. However, choosing the right tool for your online store goes beyond these basics. Each tool offers unique features, integrations, and capabilities that cater to different business needs and skill levels.
So, let’s dive deeper into a detailed exploration of each one, starting with Google Analytics 4.
GA4: The Foundation of Web & Conversion Tracking
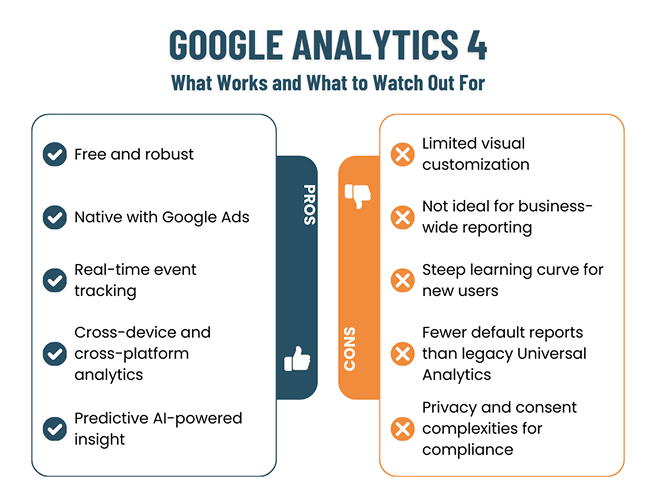
Google Analytics 4 (GA4) has become the gold standard for tracking online stores, providing a comprehensive view into how visitors interact with your website and what drives conversions. The shift from Universal Analytics to GA4 was completed in July 2023, marking a significant milestone in Google’s analytics story and introducing a fresh approach for web and app data.
Since then, GA4 has continued to evolve, with 2025 bringing even more automation, enhanced event tracking, and user-friendly features designed for both business owners and marketers. So, let’s take a closer look at its key features that help online stores thrive:
- Enhanced eCommerce Tracking: From shopping behaviors to product performance, GA4 captures every phase of your customer journey—including cart additions, checkouts, and purchases.
- Real-Time Traffic and Funnel Behavior: Instantly see how visitors move through your site, where they drop off, and what actions lead to sales.
- Cross-Domain and Event-Based Tracking: Seamlessly track users across multiple domains and devices, capturing every vital interaction along the way.
GA4 shines when you want data fast and decisions even faster, but it’s not a one-size-fits-all solution. For lean teams focused on digital performance, it’s a no-brainer. If you’re looking for deeper insights across your entire business or need custom visual flair, you might find yourself reaching for something more robust.
Before we sum this up, let’s explore the key pros and cons to help you see when and why GA4 works best for your store.
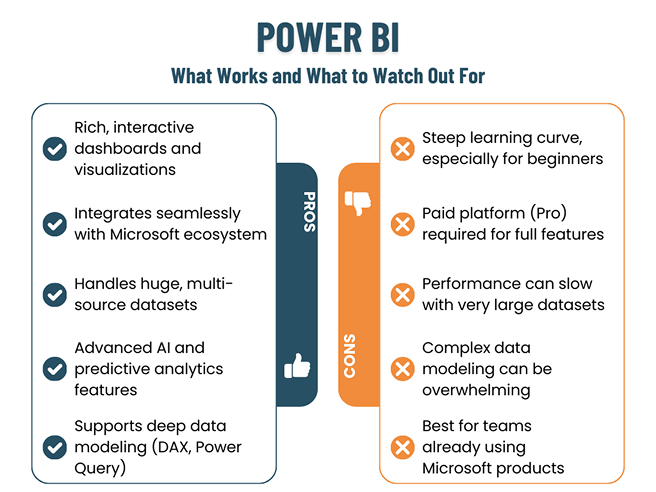
Power BI: Deep-Dive Reporting for Decision-Makers
Power BI stands out as the go-to platform for businesses ready to turn their data into a real strategic advantage. It enables you to unify data from across your store, marketing, sales channels, CRM, and beyond, letting decision-makers visualize trends and spot opportunities at a glance. Its powerful dashboards and data modeling tools transform endless rows of numbers into actionable insights. Some of the key features that make Power BI users’ favorite are:
- SKU-Level Analytics: Dive deep into individual product performance and profitability for precise decision-making.
- Retention & Cohort Modeling: Track customer behavior over time to identify loyal customers and optimize marketing efforts.
- Multi-Data Source Integration: Combine data from your CRM, marketing platforms, and sales channels for a unified business view.
- AI-Powered Insights: Recent updates make Power BI more intuitive, enabling custom reports and more thoughtful analysis to drive growth.
Whether you’re managing multiple stores or navigating complex sales cycles, Power BI’s flexibility lets you connect, analyze, and share actionable intelligence across your whole team. For those who want complete control over their data story, Power BI delivers clarity and confidence.
Now, let’s break down its key strengths and challenges:
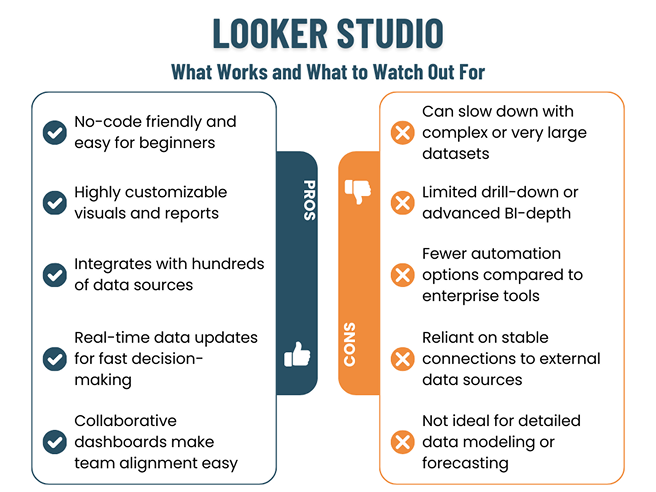
Looker Studio: Real-Time Dashboards for Marketing Teams
Looker Studio carves its niche as the go-to tool for teams seeking fast, visually engaging reporting, without the technical complexity of traditional BI platforms. Popular among marketers, agencies, and growing eCommerce brands, Looker Studio transforms raw data into intuitive, interactive dashboards in just a few clicks. It’s designed with accessibility in mind, so even non-technical users can turn numbers into clear visual stories that inspire action.
Some of the key features that make Looker Studio a favorite include:
- Drag-and-Drop Dashboarding: Build custom, shareable reports using a simple, no-code interface—perfect for busy marketing and sales teams.
- Real-Time Data Visualization: Instantly visualize marketing campaigns, channel performance, and website metrics as they happen.
- Seamless Integration: Connect with Google products (Ads, Analytics, Sheets) and hundreds of third-party platforms to centralize all your insights in one place.
- Collaborative Reporting: Make data-driven decisions as a team with interactive dashboards that are easy to share and update across your organization.
These powerful benefits make Looker Studio an indispensable ally for marketing teams aiming to stay agile and informed. But before we wrap up, it’s essential to weigh the whole picture. Let’s dive into the pros and cons to see where Looker Studio truly shines and where it might face challenges.
The best analytics tool fits your business, team, and goals.
- Choose Looker Studio for simple, collaborative reporting and real-time marketing insights.
- Choose Power BI if you require in-depth data integration, advanced analytics, and utilize Microsoft products.
- Go with GA4 for a robust, cost-effective way to track website activity and marketing within Google’s ecosystem.
Each tool helps your team turn data into growth-driven decisions, and to make your choice even easier, we’ll next look at practical use cases for each.
When to Use Each Tool: Use Case Scenarios
Selecting the right analytics platform is crucial for meaningful business insights and driving growth. Understanding your unique challenges and objectives can simplify this decision. Below is a practical guide highlighting common business scenarios alongside the most effective analytics approach for each, helping you optimize your data strategy with confidence.
Starting Your Analytics Journey with Essential Insights
For businesses beginning to explore analytics, a straightforward solution that captures fundamental website and user behavior data is vital. This empowers small teams and individuals to quickly grasp baseline performance metrics without the complexity of advanced setups.
Achieving Holistic Marketing ROI Across Channels
When your goal is to unify data from diverse marketing sources—such as paid ads, social media, and email campaigns—for a full view of return on investment, flexible, visual, and real-time reporting dashboards streamline campaign optimization and collaboration.
Gaining Deep, Product-Level Profitability Analysis
Organizations that require precise measurement of sales, margins, and costs at the SKU level need robust data modeling capabilities to support their operations. Detailed dashboards enable the identification of high-performing products, sharpening pricing and inventory decisions.
Delivering Executive-Ready, Strategic Reporting
Clear, visually compelling dashboards that highlight critical KPIs and customer lifetime value are essential for leadership. These reports facilitate informed decision-making at the highest level, supporting strategic planning and informed investment decisions.
Overseeing Performance Across Multiple Markets or Stores
Companies operating in several regions or managing multiple storefronts benefit from integrated user behavior tracking combined with comprehensive data aggregation. Such insights allow for comparison across segments and better-targeted marketing and operational strategies.
Designing Customized, Client-Focused Dashboards for Agencies
Agencies seeking to provide branded, professional dashboards to clients require tools that offer white-label functionality and extensive data integration capabilities. This enables the creation of tailored, shareable reports that enhance client communication and satisfaction.
This practical understanding of business scenarios will help you align your data strategy with the most effective analytics tool for your needs, enabling smarter decisions and stronger business outcomes. Individually, each of these tools performs exceptionally well, but to truly get their full potential and gain more profound, more comprehensive insights, understanding how they can work together is key.
Can These Tools Work Together?
In today’s interconnected, data-driven landscape, no single analytics tool can capture every facet of a growing business’s needs. An ideal analytics architecture integrates multiple platforms, combining their strengths to build a comprehensive, flexible, and scalable data ecosystem. By connecting tools like Google Analytics 4, Looker Studio, Power BI, and data warehouses like BigQuery, businesses create a unified pipeline that drives richer insights and more informed decision-making.
These tools work together effectively in several common ways:
- GA4 Feeding into Looker Studio: For marketing teams seeking real-time, visually intuitive dashboards, GA4 serves as the primary data source, providing user behavior and conversion data to Looker Studio’s customizable reports. This integration provides seamless, up-to-date campaign monitoring without requiring significant technical investment.
- GA4 + BigQuery Feeding Power BI: When deeper data modeling and enterprise-grade analysis are needed, GA4’s raw data exports to BigQuery become the backbone for Power BI. This setup enables advanced querying, allowing for the blending of GA4 data with other business sources to provide comprehensive, SKU-level analytics on profitability and retention.
- Cross-Platform Stacks for Advanced Users: Experienced teams often combine these platforms in hybrid stacks where each tool plays to its strengths. For example, GA4 and Looker Studio support marketing insight needs, BigQuery handles large-scale data warehousing, and Power BI delivers enterprise reporting and predictive analytics—giving you best-in-class capabilities across your entire data workflow.
An integrated analytics approach enables you to combine the unique strengths of GA4, Looker Studio, Power BI, and BigQuery to gain a comprehensive and accurate view of your business. For example, GA4 collects user data that can feed into Looker Studio for real-time marketing dashboards, while exporting GA4 data to BigQuery enables deeper analysis in Power BI with advanced data modeling and cross-source insights. This combination breaks down data silos, making insights more transparent and more actionable across marketing, sales, and executive teams.
By connecting these tools, you create a seamless data ecosystem that supports better collaboration and smarter decision-making. Suppose you’re looking to simplify your reporting further, especially by combining CRM, ERP, and eCommerce data into one place. In that case, give a read to our exclusive latest blog on integrating CRM, ERP, and eCommerce Data into One Dashboard to build a unified dashboard that drives growth and efficiency.
What to Consider When Choosing Your Analytics Tool?
Selecting the right analytics tool is about finding a solution that fits your unique business context and enables your team to get actionable insights without unnecessary complexity. This decision hinges on several key factors.
Understanding these basics will not only help you avoid costly mistakes but also ensure your analytics investment supports your business goals both today and as you grow.
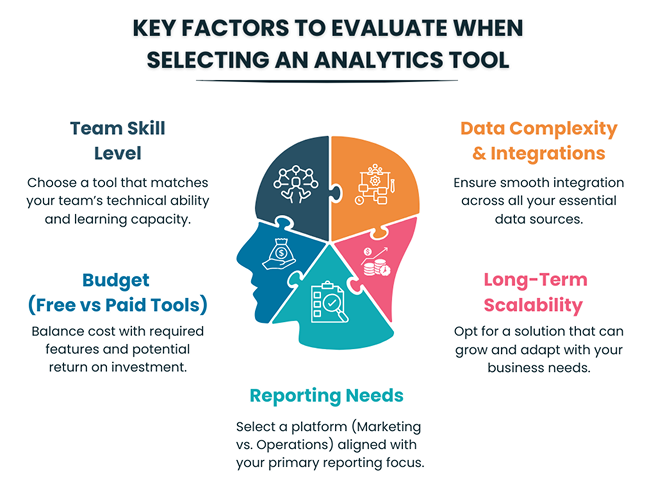
While these key factors are essential to consider, managing them all can be overwhelming. Hiring a data analyst who offers white-labeled services can alleviate this burden, ensuring you receive expert insights and tailored solutions without the hassle of evaluating multiple tools yourself.
Conclusion
This brings us to the end of this blog. We have explored the top three analytics tools, highlighting their strengths and ideal use cases to help you make a more informed choice. For detailed pricing information, we recommend visiting the official pages of each platform, as costs may vary depending on features and scale.
Remember, it’s perfectly fine to start simple and expand your analytics capabilities as your business grows. Getting started early with the proper fundamentals sets the stage for long-term success. To make this process even easier, you can take advantage of our free Analytics Consultation. Our experts are ready to guide you in selecting or setting up the most suitable analytics tool tailored to your unique business needs.