

A client sees conversions down 30% and wants answers before the next reporting call. The instinctive response may be to reduce the budget, replace the creative, adjust targeting, or blame the advertising platform. But none of these decisions should be made until the agency answers a more important question: what exactly declined, and where did the loss enter the customer journey?
The cause could be weaker demand, broken conversion tracking, creative fatigue, landing-page friction, lower lead quality, or delayed revenue attribution. In some cases, Google Ads or Meta Ads may report a decline while the client’s CRM shows that qualified pipeline remains stable.
You may not completely fix a 30% ad performance drop in 15 minutes. You can, however, identify the most likely point of failure and avoid optimizing the wrong part of the campaign.
What Does a 30% Drop in Ad Performance Actually Mean?
“Performance is down” is not a diagnosis. It is only the beginning of one.
A client may be referring to fewer leads, while the media buyer is concerned about a higher cost per click. Meanwhile, the sales team may be receiving the same number of opportunities but closing fewer of them.
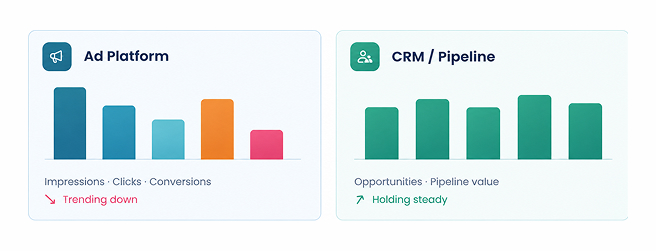
The first distinction is whether the decline exists only inside the advertising platform or has reached the client’s pipeline and revenue.
| Platform-Level Decline | Business-Level Decline |
| Fewer impressions | Fewer sales opportunities |
| Lower click-through rates | Lower qualified lead rate |
| Higher cost per click | Higher customer acquisition cost |
| Higher cost per lead | Lower pipeline value |
| Lower reported ROAS | Lower verified revenue |
A 30% increase in cost per click may cause little commercial damage if the new traffic converts at a higher rate. Similarly, a lower cost per lead can look efficient while hiding a growing volume of spam, low-intent enquiries, or prospects outside the client’s target market.
The difference becomes clearer when CPL and qualified-lead cost are examined together.
Suppose a B2B campaign reduces its CPL from $80 to $60. On the surface, performance has improved by 25%. But its lead qualification rate falls from 40% to 15%.
- Previous cost per qualified lead: $80 ÷ 40% = $200
- Current cost per qualified lead: $60 ÷ 15% = $400
The campaign is producing cheaper leads while doubling the actual cost of generating a sales-qualified lead.
Before opening Google Ads or Meta Ads Manager, establish whether the decline affected visibility, engagement, conversions, qualified pipeline, or revenue. That answer determines where the investigation should begin.
The 15-Minute Client Ad Performance Diagnostic
A useful paid media diagnostic does not involve checking every available metric. It follows the customer journey, identifies the first meaningful change, and connects that change with the final business outcome.
| Time | Question to Answer | Decision |
| 0-3 minutes | Is the decline real? | Measurement issue or actual performance issue |
| 3-6 minutes | Where did the funnel weaken? | Delivery, engagement, conversion, or sales |
| 6-9 minutes | What changed before the decline? | Internal campaign change or external movement |
| 9-12 minutes | Has the audience stopped responding? | Creative, offer, or landing-page problem |
| 12-15 minutes | Did the decline affect revenue? | Monitor, optimize, or escalate |
The first three minutes are not spent optimizing. They are spent confirming whether there is anything to optimize.
Minutes 0-3: Confirm That the Performance Drop Is Real
An advertising dashboard should never be the agency’s only source of truth. Compare the same date range across the ad platform, GA4, CRM, call-tracking system, form submissions, and verified sales data.
The relationship between these sources can quickly narrow the investigation.
| What The Data Shows | Most Likely Interpretation |
| Ads conversions down; CRM leads stable | Tracking or attribution issue |
| Ads and CRM leads both down | Genuine traffic or conversion decline |
| Leads stable; qualified leads down | Lead-quality problem |
| Opportunities stable; reported ROAS down | Revenue attribution or conversion-lag issue |
| Form leads down; calls increased | Conversion behavior may have shifted |
Consider what happens when the campaign is blamed for a failure that actually begins on the website.
A lead-generation campaign reports 35% fewer conversions after a website update. CTR, CPC, and landing-page sessions remain almost unchanged. The agency prepares to change the audience and bidding strategy, but a test submission reveals that the mobile form fails after the user clicks “Submit.”
The ads did not stop working. The conversion path did.
Test the form on desktop and mobile, confirm that the thank-you event fires, inspect the UTMs, verify call tracking, and compare CRM timestamps with platform conversions. Recent changes to consent settings, landing pages, form plugins, conversion actions, or offline conversion imports also deserve attention.
The need to connect advertising data with real customer outcomes is not theoretical. Volkswagen Middle East had to measure a customer journey that moved from online enquiries to offline dealership actions. The company developed a measurement infrastructure that connected CRM data with Google Analytics and Search Ads 360.
Instead of treating every online conversion as equally valuable, Volkswagen assigned greater value as prospects moved closer to a purchase. A qualified lead received more value than a basic form submission, while a test drive represented further commercial progress. This allowed the media team to understand which advertising interactions were producing meaningful offline outcomes. Read the Volkswagen Middle East case study on Think with Google.
For agencies, the lesson is straightforward: a platform-level performance drop cannot be interpreted accurately when the ad account sees only the first conversion and the CRM holds the outcomes that matter most.
If traffic behavior remains stable but reported conversions fall suddenly, measurement and functionality should be checked before campaign delivery is changed. Automated bidding trained on incomplete conversion data can turn a website problem into a campaign problem.
Minutes 3-6: Find the First Point Where the Funnel Changed
Once the decline is verified, trace the complete customer journey:
Impressions → Clicks → Landing-page visits → Leads → Qualified leads → Opportunities → Revenue
The objective is not to identify every metric that declined. It is to locate the first meaningful break.
If impressions and clicks fall together, the problem probably begins before the website. Budget limitations, bid competitiveness, campaign eligibility, audience size, auction pressure, or lower search demand may be restricting delivery.
If clicks remain stable but leads decline, the ads are still attracting traffic. The problem is more likely connected to traffic quality, landing-page relevance, offer strength, form functionality, page speed, or conversion tracking.
If leads remain stable but qualified opportunities fall, the problem sits further down the funnel. Search intent, geographic targeting, audience quality, qualification criteria, or the conversion goal used for optimization may be attracting people who complete forms but are unlikely to buy.
The first metric to decline shows where to investigate. The final metric to decline shows how much the problem is costing the business.
A funnel-level comparison prevents the agency from treating every performance problem as a media-buying problem. Once the break is located, the next step is to identify what changed immediately before the decline began.
Minutes 6-9: Review What Changed Before Performance Declined
Campaign performance rarely deteriorates in isolation. The decline often follows an account edit, website release, offer change, competitor promotion, pricing decision, tracking update, or seasonal shift.
The account’s change history can reveal whether the performance drop began after one of these adjustments.
| Changed Made | Possible Effect |
| Target ROAS increased | Delivery expands into less-proven inventory |
| Cost cap reduced | The campaign becomes more selective and loses volume |
| Conversion goal changed | The algorithm begins optimizing for a different action |
| Multiple ad sets launched | Budget and learning signals become fragmented |
| Negative keywords added | Relevant demand may be unintentionally excluded |
| Landing page replaced | Message match or conversion rate may decline |
| Offer or pricing changed | Demand weakens even when the ads remain effective |
A common agency account situation shows how individually reasonable edits can collectively restrict performance.
An agency sees CPA increase after adding tighter geographic targeting, new audience exclusions, and a lower cost cap during the same week. Each change appears sensible on its own. Together, they reduce the eligible audience and limit the platform’s ability to find conversions.
Adding more restrictions would be unlikely to solve the problem. A better response would be to compare performance before and after the edits, identify the most restrictive change, and restore enough signal volume for the bidding system to learn.
Audience fragmentation can also divide limited budgets and conversion signals across too many campaigns or ad sets. On Google Ads, changes to bidding, conversion goals, search coverage, campaign eligibility, or Performance Max assets can alter delivery. On Meta Ads, repeated significant edits may interrupt learning before the system has enough stable data to optimize.
Campaign history is often more revealing than the recommendations tab. When a decline begins immediately after a meaningful edit, the agency should determine whether the account needs time, a controlled reversal, or a structural correction.
Minutes 9-12: Determine Whether the Audience Stopped Responding
If delivery remains stable but engagement or conversion weakens, the problem may be less technical and more human. The audience may have seen the message too often, stopped believing the promise, or found a competitor’s offer more relevant.
Similar symptoms can come from very different problems. The surrounding metrics help separate creative fatigue from landing-page friction and a broader message-market mismatch.
| Signal | Likely Problem | What Needs To Change |
| Frequency rises while CTR falls | Creative fatigue | Hook, visual, format, or angle |
| CTR remains healthy but conversions fall | Landing page or offer friction | Message match, proof, UX, form, or offer |
| CTR and conversion rate both fall | Message-market mismatch | Positioning, audience, or customer need |
The distinction becomes visible when a creative refresh changes the appearance of the ad but not the idea behind it.
A Meta Ads campaign shows rising frequency and declining CTR. The agency changes the image but retains the same headline, promise, offer, and CTA. Performance improves briefly and then falls again.
The audience was not merely tired of the visual. It was tired of the idea.
A meaningful creative refresh may require a different pain point, proof point, objection, format, offer, or stage of customer awareness. Changing colors will not repair a promise that the market no longer finds compelling.
The transition from ad to landing page matters just as much. An ad promoting a quick consultation should not send users to a generic service page with several competing calls to action. A healthy CTR followed by a weak conversion rate frequently indicates that the advertising promise and landing-page experience are not aligned.
Even when new creative restores clicks, the campaign has not necessarily recovered. The final three minutes must determine whether those clicks produce commercially valuable outcomes.
Minutes 12-15: Connect Platform Performance to Lead Quality and Revenue
The final diagnostic compares the advertising account with the CRM. This is where an agency moves beyond reporting media activity and begins explaining business performance.
Rewaa, a Saudi Arabian B2B software company, provides a strong real-world example. Its advertising was generating interest, but the company needed its campaigns to produce better sales outcomes-not merely more initial conversions.
Rewaa connected different stages of its customer journey with Google Ads. As a prospect progressed toward becoming a customer, the new lifecycle stage was passed back to the platform as a higher-value conversion. This allowed Google Ads to distinguish a basic enquiry from a marketing-qualified or sales-qualified lead.
By focusing its data-driven advertising strategy on lead quality, Rewaa achieved:
- 96% increase in overall ROAS
- 80% increase in marketing-qualified lead conversions
- 89% increase in sales-qualified lead conversions
- 45% reduction in cost per sales-qualified lead
According to Google, these results were achieved in just over one month. Read the Rewaa case study on Google.
The biggest lesson is not simply to import more data. It is to send the advertising platform signals that represent genuine commercial progress. If every form submission is treated as equally valuable, AI-powered bidding can become highly efficient at generating conversions that sales does not want.
An agency can avoid overvaluing surface-level metrics by judging performance in the following commercial order:
- Revenue and closed customers
- Sales-qualified opportunities
- Marketing-qualified leads
- Total leads
- Platform conversions
- Clicks and engagement
Clicks matter because they contribute to conversions. Conversions matter because they should create pipeline. Pipeline matters because it should create revenue.
The further a metric is from revenue, the less confidently it should be used to evaluate overall paid media performance.
When a 30% Performance Drop Is Not a Crisis
Percentages without sufficient context can make normal account movement look like an emergency.
The percentage can create a particularly misleading sense of urgency when a campaign operates with a small conversion volume. A specialist B2B campaign may generate ten conversions one month and seven the next. The dashboard reports a 30% decline, but the actual difference is only three conversions.
That may be too little data to justify rebuilding the campaign without first examining normal monthly variation, lead quality, qualified pipeline, and deal value.
The duration, data volume, and commercial impact of the decline should determine how quickly the agency responds.
| Situation | Agency Response |
| Short-term decline with stable qualified pipeline | Monitor |
| Sharp decline after a tracking or website change | Investigate immediately |
| Multi-week decline across traffic and conversions | Optimize |
| Lower lead volume with higher opportunity value | Evaluate commercially |
| Decline after several simultaneous edits | Stabilize and isolate |
| Category-wide reduction in demand | Reforecast and reposition |
Conversion lag also matters, particularly in accounts with longer sales cycles. Leads generated near the end of the reporting period may not yet have become opportunities or customers. One large sale can also make the previous period’s ROAS unusually difficult to repeat.
A 30% decline should therefore be tested against four questions:
- Is the comparison period statistically meaningful?
- Has the decline continued long enough to establish a pattern?
- Has qualified pipeline also fallen?
- Has verified revenue been affected?
The agency’s job is not to react fastest. It is to determine whether the decline represents temporary noise, a measurement fault, or a genuine commercial trend.
What Is Actually Causing the Performance Decline?
By this stage, most performance drops can be placed into one of four categories. Identifying the correct category prevents unrelated optimizations from creating additional instability.
Measurement Failure
The desired customer action may still be happening, but tracking, attribution, or reporting is incomplete.
A form event may stop firing, call tracking may fail, CRM data may not sync, or qualified offline conversions may no longer be imported into the advertising platform. When Smart Bidding or another AI-powered bidding system receives incomplete conversion signals, it begins making decisions using an inaccurate picture of customer value.
Delivery Failure
The campaign cannot reach enough relevant demand at the required cost.
Restrictive bids, limited budgets, narrow audiences, policy issues, feed disapprovals, audience fragmentation, increased auction competition, or insufficient conversion volume can reduce delivery. The account may need more usable data and freedom to optimize-not another layer of targeting restrictions.
Conversion Failure
People reach the website but do not take the intended action.
The cause may be weak message match, slow page speed, a confusing mobile experience, an uncompetitive offer, excessive form fields, missing proof, or a technical failure. Stable traffic combined with a declining conversion rate is a strong reason to inspect the post-click experience.
Lead-Quality Failure
The campaign generates conversions, but those conversions do not become qualified opportunities.
Low-intent search terms, misleading creative, broad geographic reach, weak qualification, spam, or optimization toward every form submission equally can increase lead volume while reducing business value.
Each diagnosis requires a different response. New creative cannot repair broken CRM attribution, and tighter targeting cannot rescue a landing page that fails on mobile.
What Should the Agency Change-and What Should It Leave Alone?
Once the likely cause is known, the agency should make the smallest controlled change capable of testing that diagnosis.
Changing the budget, creative, targeting, bidding strategy, and landing page simultaneously may improve results, but it will not reveal what actually worked. It can also create fresh learning volatility before the original problem is understood.
| Diagnosis | First Action | Recovery Signal |
| Measurement failure | Repair and validate the conversion event | Platform and CRM data begin reconciling |
| Delivery failure | Remove the most restrictive limitation | Eligible reach and conversion volume recover |
| Creative fatigue | Test a genuinely different message angle | CTR improves without lowering lead quality |
| Landing page failure | Correct the largest conversion barrier | Conversion rate improves at similar traffic quality |
| Lead-quality failure | Send qualified outcomes back to the platform | Cost per qualified lead begins falling |
| Demand decline | Adapt positioning, offers, and forecasts | Relevant response improves within available demand |
Suppose a service campaign generates enough enquiries, but most come from outside the client’s preferred location or below its minimum project value. Increasing the budget would only purchase more of the same low-quality demand.
A stronger response would be to improve geographic relevance, introduce qualifying language, review search intent, and pass qualified-lead or offline conversion outcomes back to the advertising platform. Total lead volume may fall, but sales acceptance and pipeline value can improve.
A useful performance recovery plan identifies one suspected cause, one controlled change, one business metric, and one review window.
What the Client Needs to Hear on the Performance Call
Clients do not need a tour of every column in Ads Manager. They need to know what declined, why it likely declined, how it affected the business, and what the agency is doing next.
A clear explanation may sound like this: “Reported conversions are down 30%, but the decline begins between the landing-page visit and form submission-not at ad delivery. Traffic and engagement remain stable. We are validating the form experience and conversion tracking before changing targeting or bidding. Recovery will be measured through verified leads and qualified opportunities, not platform conversions alone.”
This acknowledges the decline without jumping to an unsupported conclusion. It connects the diagnosis to evidence, establishes the next action, and gives the client a commercially relevant recovery metric.
Good reporting does not make a decline sound smaller. It makes the cause, business impact, and response easier to understand.
Conclusion
A 30% decline can originate in the advertising platform, website, tracking setup, CRM, sales process, or market itself. Looking only at campaign metrics may reveal the symptom without identifying the cause.
A complete paid media performance audit connects: Campaign delivery → Audience response → Website conversion → Lead qualification → Sales opportunity → Revenue
When these stages are reviewed together, the agency can determine whether the client needs a campaign adjustment, creative refresh, landing-page improvement, conversion tracking repair, CRM integration, or wider performance marketing strategy.
Before You Cut the Budget, Find the Real Leak
Diagnose My Ad Performance
FAQs
How does your team use AI and automation in campaign management?
We use AI-assisted bidding, audience signals, automated reporting, creative analysis, and performance alerts to improve speed and decision-making. Our specialists still review strategy, lead quality, budget allocation, and every major campaign change.
Will automation replace human campaign management?
No. Automation processes data and handles repeatable tasks, while our team provides the commercial judgment. We decide what should be automated, monitor its output, and step in when platform recommendations do not support the client's goals.
How does your billing work for agency partnerships?
We offer flexible hourly, part-time, and full-time engagement models. Your agency can choose support based on its active accounts, campaign volume, delivery needs, and available client budget.
Will we know exactly what we are being billed for?
Yes. We maintain clear work records covering the tasks completed, time used, campaign changes, findings, and next actions. Your agency receives visibility into the work behind every billable hour.
Can we scale your support as our client workload changes?
Yes. You can increase or reduce our involvement as your client pipeline, campaign volume, and delivery requirements change-without committing to additional permanent in-house overhead.
Are media spend and management fees reported separately?
Yes. We keep client ad spend, platform charges, and our management fees clearly separated so your agency can understand costs and report them accurately.
How transparent is your campaign management process?
Our team documents important campaign changes, budget decisions, tests, outcomes, and recommendations. Your agency retains access to the accounts and can see what was changed, why it changed, and how it affected performance.