ZealousWeb
eCommerce data reporting

Common Mistakes in eCommerce Data Reporting and How to Avoid Them

October 15, 2025Posted By: Manjiri Bhate
Data ReportingeCommerce analyticsKPI TrackingReporting Automation

Would you believe that by the time you finish reading this blog, over 400 million terabytes of new data will have already been created around the globe? That’s not just numbers; it’s an endless stream of customer clicks, transactions, social media buzz, and video plays racing past every second. In fact, experts estimate total global data generation will reach an astounding 182 zettabytes this year alone.

To keep up, eCommerce companies invest heavily in building expert teams, acquiring cutting-edge tools, and developing sophisticated reporting systems. They set up tracking platforms, dashboards, and analytics software, expecting clear insights that spark real growth. Despite all that effort and investment, many brands still find themselves stuck. They face common but costly hurdles that turn their data into noise rather than knowledge. Instead of maximising their full potential, they end up with reports that confuse rather than clarify.

This blog is here to change that. We’ll explore those real-world challenges, call out the top reporting mistakes that hold businesses back, and—most importantly—give you practical fixes to turn your data reporting into a powerful, insight-driven engine for growth that genuinely works for your business.

What is “eCommerce Data Reporting”?

Before we dive into the common mistakes and their fixes, let’s get clear on the basics—and on how reporting is different from analytics.

Reporting is like taking a snapshot. It’s the process of collecting, organizing, and presenting raw data in charts, tables, or summaries. It answers the “what happened?” question.

Analytics goes a step further. It’s about interpreting that data to understand why something happened and what you should do about it. While reporting shows you the numbers, analytics turns them into stories, trends, and actionable strategies for growth.

Both matter, and when you combine them effectively, you get a complete picture of your business performance through different types of eCommerce reports, including:

  • Sales Reports: Track revenue, orders, refunds, and average order value to measure financial performance.
  • Customer Behavior Reports: Show how visitors navigate your site, what they buy, and how often they return.
  • Campaign Performance Reports: Evaluate marketing efforts by tracking traffic sources, conversions, and ROIs.
  • Product Insights Reports: Analyze individual product sales, profitability, and inventory trends to optimize offerings.

To bring all this together, most eCommerce brands rely on tools like Google Analytics 4 (GA4), Shopify Reports, Power BI, and Looker Studio (formerly Google Data Studio). Mastering these basics will make it easier to spot the gaps in your current reporting—and fix them—so your data becomes one of your strongest growth assets. Usually, people get confused between these tools because each has its expertise and is best suited for specific outcomes. If you’re wondering which tool to lean on or how they differ, check out our latest blog where we break down their unique strengths and use cases. Give it a read here.

With the groundwork in place, it’s time to uncover the 7 most common—and often costly—mistakes eCommerce brands make in their reporting, along with the fixes that can turn things around.

Mistake #1: Tracking Vanity Metrics Instead of Business KPIs

One of the biggest mistakes eCommerce brands make is focusing too much on vanity metrics. Vanity metrics often include pageviews, bounce rates, and sessions without a clear purpose. These numbers look impressive, but don’t drive meaningful business decisions. For example, you might see a spike in pageviews and think your site is booming. But if those visitors aren’t making purchases or engaging with your brand in valuable ways, the numbers don’t translate into real progress.

So what should you focus on instead?

Track business KPIs that directly impact your bottom line and reveal the health of your eCommerce store. These include:

  • Conversion Rate: The percentage of visitors who complete a purchase, a clear indicator of how effectively your site turns browsing into buying.
  • Customer Lifetime Value (LTV): The total revenue a customer is expected to generate over their relationship with your brand, helping you understand long-term profitability.
  • Average Order Value (AOV): The average amount spent per transaction, guiding your strategies around pricing and promotions.
  • Product Profitability: Breaking down which products truly contribute to profit, not just sales volume, so that you can optimize inventory and marketing efforts.

The smart way to fix this is to create goal-based dashboards that align directly with your business outcomes. Instead of getting distracted by shiny but irrelevant numbers, focus your reporting on these key metrics that tell the real story of your store’s performance. Tailor your dashboards to highlight progress toward specific goals so every report you read helps guide actionable decisions.

This shift from vanity metrics to meaningful KPIs transforms and drives growth, helping you focus on what truly matters to succeed.

Mistake #2: Misconfigured or Incomplete GA4 Setup

A major stumbling block for many eCommerce brands is having a Google Analytics 4 (GA4) setup that’s either misconfigured or incomplete. GA4 is a powerful tool, but if it isn’t configured correctly, the data you rely on can be misleading or inaccurate, making it very tough to make smart business decisions.

Common issues include:

  • Missing enhanced eCommerce events: Not tracking important actions like product views, add-to-carts, or checkout progress means you lose visibility on customer journeys and can’t identify drop-off points.
  • No proper source/medium attribution: Without accurate attribution, you can’t see which marketing channels are bringing in customers, leading to poor budget allocation and wasted ad spend.
  • Inaccurate revenue tracking: If revenue tracking is off, your sales performance and ROI metrics won’t reflect reality, making decision-making risky..

The smart way to fix this is to conduct a complete GA4 audit to identify and resolve tracking errors or gaps. Then, set up full-funnel tracking using Google Tag Manager (GTM) to monitor every key event—from the moment a visitor arrives until they complete a purchase. This gives you a clear view of the entire customer journey and allows you to make better, evidence-based decisions.

If setting up GA4 feels too technical, don’t worry—we have an exclusive guide to set up GA4 without needing tech expertise. Give it a read!

Mistake #3: Relying Only on Native Platform Reports

One common mistake many eCommerce brands make is relying solely on reports provided by their native platforms, like Shopify or Magento. While these reports offer convenient access to sales and customer data, they often present a narrow and limited view of your business performance.

Native platform reports typically focus only on on-site data and sales within that specific ecosystem. This means you miss out on insights on marketing campaigns on other channels, or customer interactions outside the platform are contributing to your results. More importantly, these reports usually lack cross-channel context, making it difficult to understand how different marketing efforts combine to drive conversions.

Other common limitations include:

  • Narrow view of reports: They focus mainly on internal platform data and don’t capture customer interactions or sales beyond that ecosystem.
  • Lack of cross-channel context: They fail to integrate data from other marketing channels, CRM, or advertising platforms, which hides the trustworthy source and effectiveness of campaigns.

As a quick and easy way to analyze data, you can integrate insights from Google Analytics 4 (GA4), your marketing platforms, and your CRM into unified dashboards. This approach combines customer behavior, marketing spend, and sales data across all touchpoints. With a holistic view, you can better understand customer journeys, optimize budgets, and make data-driven decisions that drive higher growth.

Mistake #4: Using Static Excel Reports That No One Checks

While Excel can be a great starting point for organizing data, static and manual reporting is slow, prone to human error, and a headache to maintain. By the time you’ve pulled the latest numbers, they may already be irrelevant. The reality is that when reports are tedious to update and offer no real-time insight, busy teams simply stop checking them. This means critical trends and issues can go unnoticed until it’s too late.

Common limitations include:

  • Time-consuming manual updates: Constantly exporting, copying, and pasting fresh data eats up valuable hours.
  • Quickly outdated information: Data is often stale by the time it’s ready, making it less useful for timely decision-making.
  • Low engagement: If reports aren’t easily accessible or visually engaging, team members will skip reviewing them.

Instead of juggling endless spreadsheets, consider automating your reporting for a more innovative approach. By integrating tools like Looker Studio, Power BI, or Google Sheets with live data connections, you can create real-time dashboards that automatically refresh with the latest numbers. These platforms also allow you to set up email scheduling, instant alerts, and interactive reports, so your team stays informed without lifting a finger.

Reporting

Mistake #5: Ignoring Customer Segmentation

Customer segmentation is the practice of dividing your audience into distinct groups based on shared characteristics, such as demographics, behavior, source, or device type. This approach enables you to understand the unique needs, habits, and values of different customer groups, rather than treating everyone as a homogeneous mass.

Ignoring segmentation and relying solely on average metrics can be misleading. For example, the behavior of first-time visitors could be very different from repeat buyers, or mobile users might convert at different rates compared to desktop users. Reporting on averages dilutes these nuanced differences and can lead to decisions that don’t fully resonate with your diverse customer base.

Common pitfalls from ignoring segmentation include:

  • Overlooking high-value customer groups with greater lifetime value.
  • Missing differences in conversion rates or product preferences across regions.
  • Inability to tailor marketing campaigns effectively for various customer segments.
  • Failing to identify device-specific behaviors that impact sales.

To fix this, create segment-based reports by source, device, geography, and behavior. Segmenting your data helps you uncover hidden opportunities, understand which channels and audiences drive the best outcomes, and tailor your strategies accordingly.

To set the stage for practical application, let’s look at some use cases that show how customer segmentation can uncover valuable insights and drive targeted strategies.

Customer segmentation

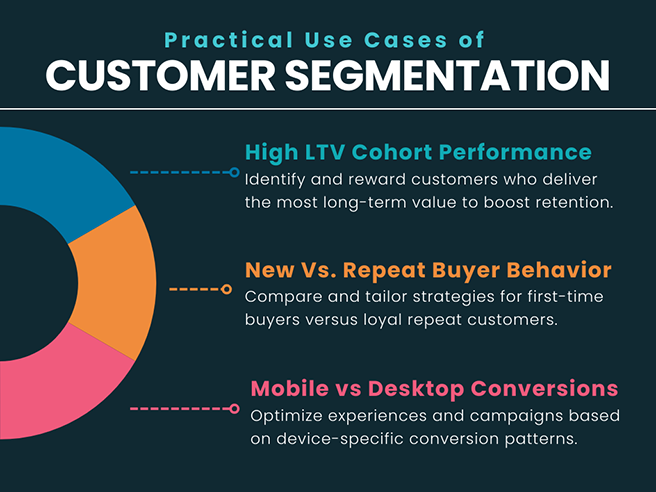
These use cases enable eCommerce brands to tailor their marketing, enhance customer experiences, and improve overall business performance.

Mistake #6: No Attribution Modeling Across Channels

Attribution modeling is the method of assigning credit to different marketing touchpoints along the customer journey. Many brands rely on “last-click” attribution, which only gives credit to the final touchpoint before a conversion. While this approach is simple, it hides the whole story and underestimates the value of the many interactions that led a customer to purchase. This can lead to misguided marketing budgets and missed opportunities.

Common pitfalls without proper attribution modeling include:

  • Overcrediting the Last Click: Overvaluing the final channel seen by the customer while undervaluing earlier, more influential touchpoints.
  • Poor Budget Allocation: Misallocating marketing spend due to an incomplete understanding of how each channel contributes.
  • Limited Optimization Opportunities: Inability to fine-tune campaigns effectively because of a narrow, last-click-only perspective.

The opposite of the attribution model is multi-touch attribution or data-driven attribution models that evaluate all the touchpoints customers engage with before converting. Modern tools like Google Analytics 4 (GA4), BigQuery, or custom-built models can analyze complex customer journeys, giving you a more accurate picture of each channel’s actual performance.

Mistake #7: Not Using Product/SKU-Level Reporting

A common but costly mistake eCommerce brands make is relying solely on overall revenue or sales figures without drilling down into product or SKU-level details. It’s important to remember that revenue is not the same as profitability; high sales volume doesn’t always translate to high profit. Without granular reporting, you might miss crucial insights about which products are truly driving your bottom line and which could be draining resources.

Common pitfalls of not using detailed product-level reporting include:

  • Ignoring product profitability: High-sales items may have low margins or high fulfillment costs, hurting overall profits.
  • Lack of inventory visibility: Without SKU-level tracking, it’s tough to manage stock effectively, leading to overstock or stockouts.
  • Missed bundling opportunities: Understanding which variants or product combinations perform best can boost average order value.
  • Ineffective promotion planning: Promotions applied broadly might fail if product-level performance is unknown, leading to wasted discounts or low ROI.

To avoid this mistake, you can break down your sales reports by SKU, category, and variant to gain clear insights into what’s working and what’s not. Detailed product-level data helps you optimize inventory management, identify profitable bundles, and design promotions. This granular approach gives you a deeper understanding of your product mix performance, allowing you to make more informed decisions that improve profitability and grow your business sustainably.

The Reporting Mistake Costing You Sales!

Data loses its value if it’s left untouched. Reports are meant to inform action. Set a clear reporting cadence, end each session with actionable takeaways, and keep insights fresh to drive timely, growth-focused decisions.

Conclusion

And that’s where we wrap up this article.

By now, you’ve seen how this blog walked you through the most common eCommerce reporting mistakes. Along the way, you’ve learned what each mistake looks like, why it matters, and how to fix it with smarter, more intentional reporting.

Remember, great reports are decision-making tools. They help you cut through the noise, focus on what matters, and create strategies that move the needle for your business. Numbers alone won’t change your business, but the insights you extract and the actions you take will.

So here’s your next step—take a moment to self-audit your reporting setup and see if you’re committing any of these costly mistakes. And if you’re unsure where to start or want clarity faster, getting expert eyes on your data can save months of trial and error. Book a free 30-minute consultation with a ZealousWeb data analyst today and get actionable, tailored recommendations to make your reports your most powerful growth engine.

FAQs

What key challenges do eCommerce businesses face when setting up reporting systems?

How can eCommerce reports provide actionable insights rather than just raw data?

What are the best practices for measuring the effectiveness of marketing campaigns across channels?

How can detailed product-level reporting improve eCommerce profitability?

Why is it essential for eCommerce businesses to establish a regular reporting review cadence?

Related Blog Posts

eCommerce reporting

Easy Ways to Set Up Reports to Track Your Online Store’s Success

October 09, 2025
Conversion OptimizationData StrategyeCommerce analyticsReporting & Dashboards
eCommerce data analytics

What Is eCommerce Data Analytics & Why Your Store Needs It in 2025?

October 06, 2025
Data-Driven MarketingeCommerce Data AnalyticsGA4 for eCommerceOnline Store Growth
Set up Google Analytics 4

How to Set Up Google Analytics 4 for Your Online Store

September 29, 2025
Data Analytics for eCommerceeCommerce Tracking SetupGA4 SetupOnline Store Tracking
analytics consultant for eCommerce

What Will a Good Analytics Consultant Do for Your Store?

September 17, 2025
analytics consultantBusiness Intelligencedata insightseCommerce Growth
eCommerce analytics tools

How Analyzing Your Store’s Data Helps You Sell More Online

September 15, 2025
Data-Driven DecisionseCommerce analyticsLooker StudioPower BI
eCommerce analytics tools

GA4, Power BI, and Looker Studio: A Comparative Guide to the eCommerce Analytics Toolkit

September 11, 2025
data visualizationeCommerce analyticsLooker StudioPower BI
attribution tracking for eCommerce

How to Make Sure You’re Getting Credit for Every Sale Online

September 09, 2025
ad spend optimizationConversion trackingDigital MarketingServer-side tracking
Ecommerce tracking

Should You Track Store Data With Server-Side or Client-Side Tracking?

September 01, 2025
Client-side trackingConversion trackingeCommerceServer-side tracking
track sales sources

How to Track Where Your Sales Come From

August 25, 2025
eCommerce GrowthMarketing AnalyticsSales trackingUTM tracking